Variation in soil and elevation generates different fertility zones in a farm. This post discusses how management zones are formed, why it's agronomically complex and might change over time for different crops, and how satellites can delineate yield maps or productivity zones of a farm. Let's deep dive into the post.
Why do farmers use fertility zones?
Ask any farmer and they will tell you, not all locations in a field are created equal! Because of the variation in soil properties and elevation, farmers get different yields for different zones in the field. This variation is the cornerstone of precision farming or variable rate applications. Zoning a farm is a significant step toward optimized resource allocation, increased productivity, and environmental stewardship. Such a data-driven approach empowers farmers with valuable insights, cost savings, farm sustainability and improved efficiency.
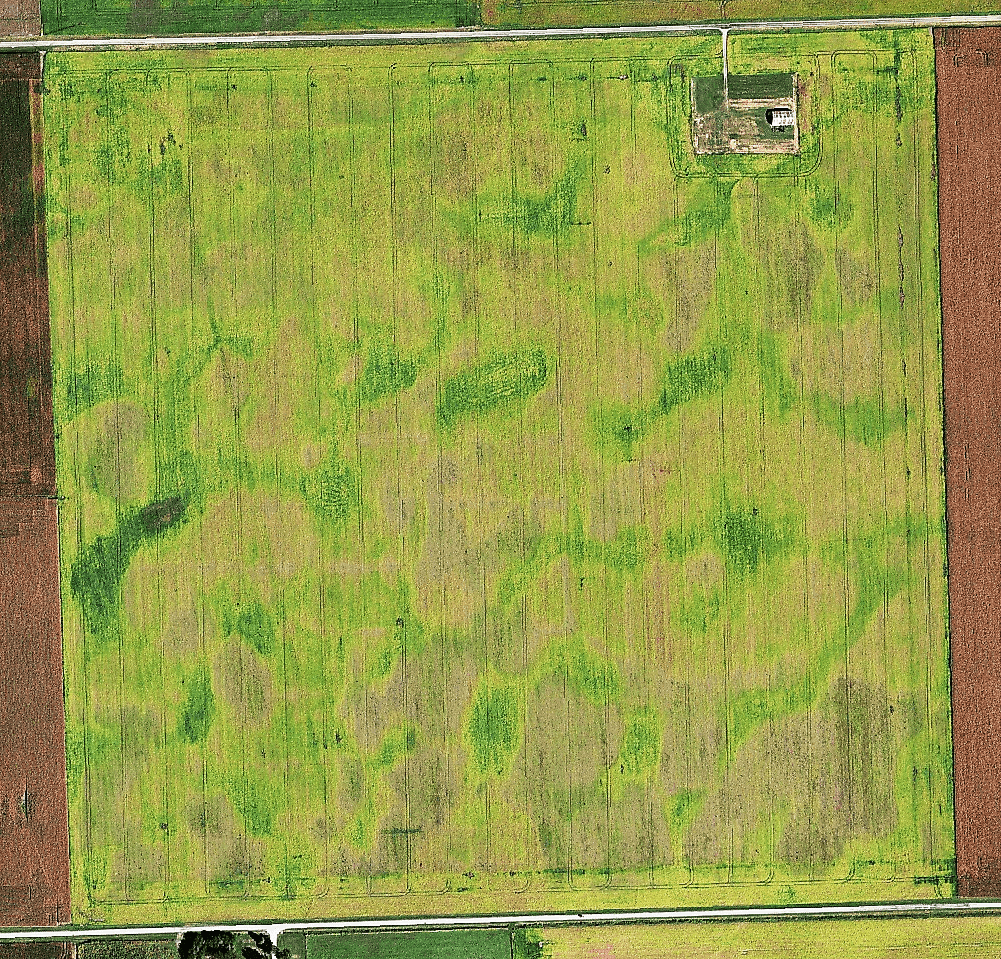
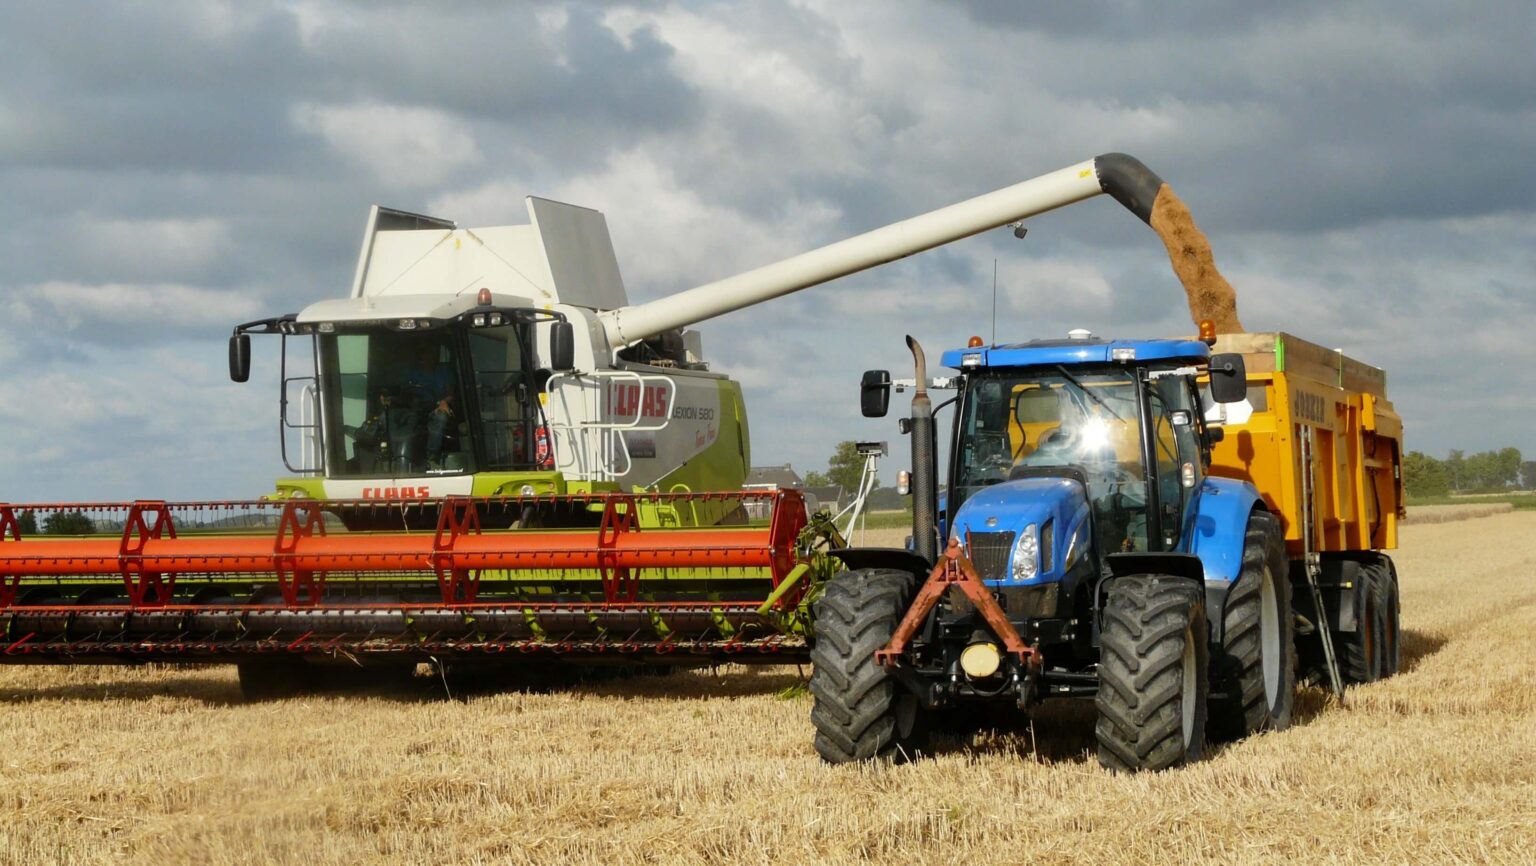
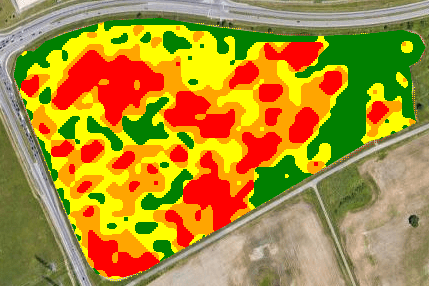
High resolution RGB satellite image of a corn farm before harvest season shows productivity variation
How is the zoning of a farm done?
There are multiple approaches toward making a prescription map, here is the highlight of different methods:
Remote sensing: Satellite images and aerial data can analyze different land features including vegetation health, and land cover patterns to identify distinct zones within the farm.
Soil Sampling and Testing: Collecting soil samples from different parts of the farm and sending them to labs for analysis enables farmers to assess soil nutrient levels, pH, and other properties. These soil tests help in defining zones with coherent soil characteristics for optimized fertilization and irrigation.
Yield Maps from Machinery: Modern farm machinery are equipped with yield monitors that record crop yield data while harvesting. These yield maps help farmers to identify areas with higher or lower crop yields, which can be used to create yield-based zoning maps.
Proximal Sensing: Advanced sensing devices, like gamma ray sensors, can provide real-time data on soil properties such as soil moisture and compaction. Such information is used in identifying areas with varying soil conditions.
Elevation and Topography Analysis: Every farmer knows that slope matters as it determines drainage patterns and areas prone to waterlogging or erosion, which leads to zoning based on topography.
Crop Growth and Phenology Observations: In person regular field observations of crop growth stages and phenology help farmers to intuitively categorize zones with similar crop development patterns and maturity levels.
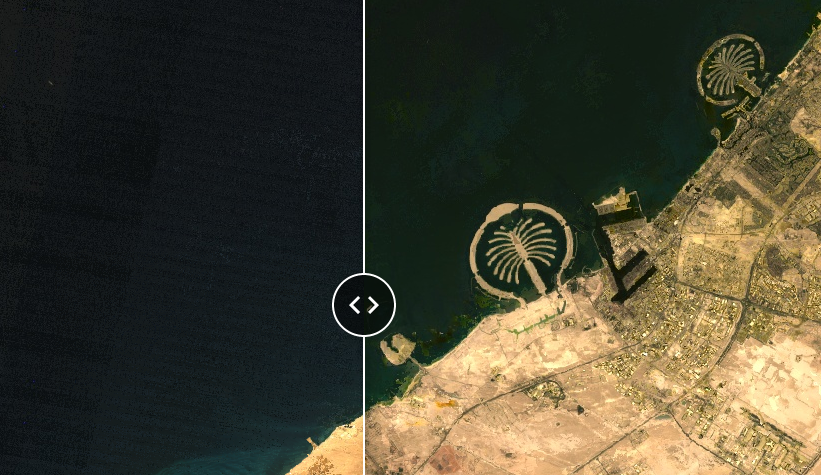
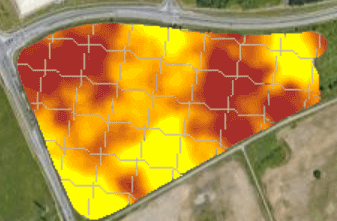
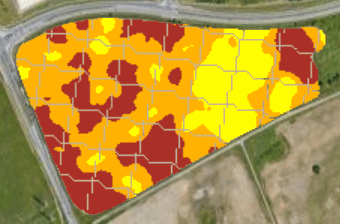
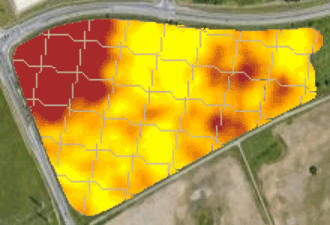
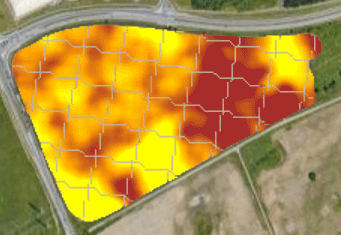
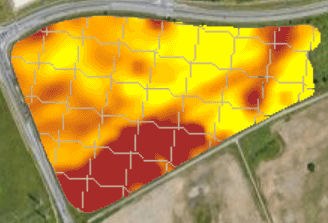
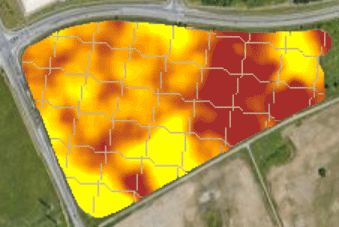
An example of a productivity map (drag slider left and right to see the variations)
Which zoning approach should a farmer choose?
Ideally, zoning should be based on a combination of different methodology, however, the labor and cost involved in different approaches makes zoning based on satellite images a viable approach for all farmers regardless of size and shape of the farm. That’s why we use satellite images to generate management zones and prescription maps. It covers the whole farm, you can see the history of the vegetation, and get updates immediately. While satellites have limited capability in detecting soil properties, they are perfect for generating fertility zones or yield maps, and that is exactly what matters, as yield is the single most important factor every farmer cares about.
Yield is the most important attribute of any farm, and satellite based productivity maps directly correlate with yield.
Vegetation performance map, yield map, and zoning
Let’s get technical and examine what’s happening behind making a yield map from a satellite. As an example, we take a corn farm in Ontario, Canada, where we know the detailed soil properties from tests. As a matter of fact, you hardly can find a strong correlation between any single soil property and yield, because yield is the cumulative outcome from all those factors. However, there is a strong correlation between satellite based vegetation map and yield map.
Farm soil CEC map
Farm soil pH map
Farm soil organic matter map
Farm soil sand map
Farm elevation map
Farm soil clay map
Variation in different soil properties
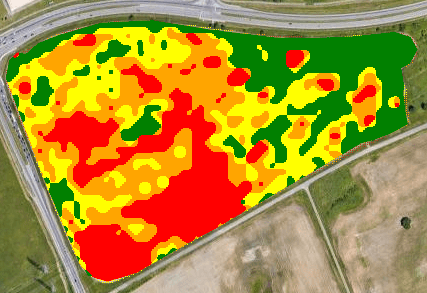
Farm productivity map
Farm yield map
Potential productivity map vs. actual yield map
Does the fertility map of a farm change over time?
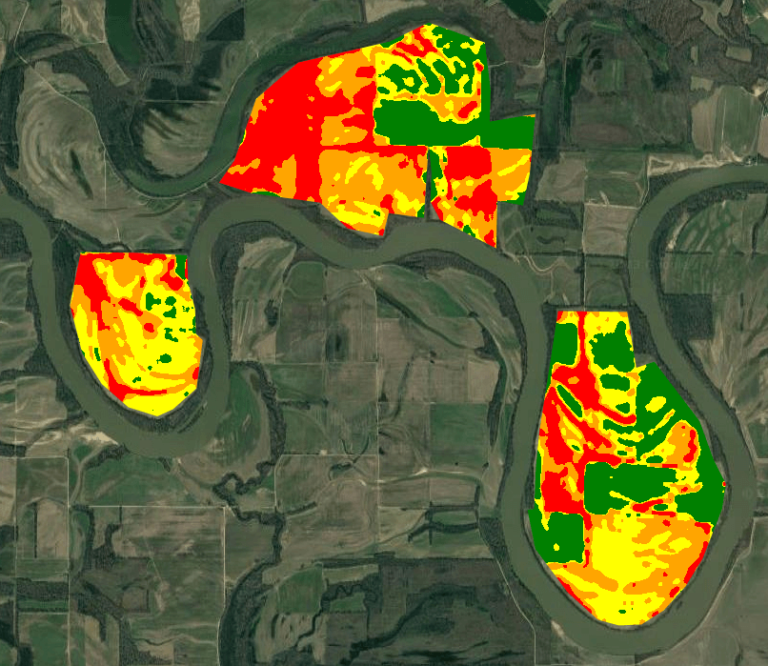
Another important aspect is the temporal pattern of prescription maps, which means how vegetation maps are changing over time. This is an example of a winter wheat farm with fallow years in between, in Kansas, United States. You can see a repeatable pattern of high and low yield areas, however, it’s not totally constant year over year. Different crops interact with soil and elevation in different ways. A water thirsty crop on tophill and downhill perform differently from a less water demanding crop. Similarly, a too dry year affects yield differently from a too wet year. Looking back at the history of a field, we take into account crop type, soil moisture, meteorological data and vegetation pattern, as we know zoning is a complex process, and there is no one size fits all in the farming.
Satellite produced variation in productivity map of a winter wheat farm in Kansas, over multiple years.
What steps are involved in making prescription maps by satellite?
After acquiring the high-resolution images, we perform preprocessing to correct distortions and enhance the quality of images. Then, we apply image analysis and land cover classification, so that different features like vegetation health and soil properties are identified. Through integration with GIS, we overlay various data layers, including soil maps and yield information. We tap into multiple data sources to make elevation maps as well. Zoning algorithms utilize this data to create distinct zones based on factors like soil fertility, topography and elevation models, and crop health. The resulting zoning map is essential for precision agriculture, enabling farmers to implement site-specific strategies and optimize their resource usage.
Making prescription maps and fertility zones of a farm could be complex and requires multiple layers of data. We use 20+ years of experience in farming and remote sensing science to generate reliable zoning.
Are you looking to develop a prescription and yield map for your farming business?