In this post, explore the significance of satellite and AI technologies in gathering grain data for global food security. Discover how real-time insights on grain production and supply chain ensure sustainability and resilience in an evolving world. And unlock the potential of artificial intelligence to estimate grain yield and empower stakeholders in the agricultural industry.
Why tracking grain statistics is important?
Grain crops (wheat, rice, maize, and soybean, etc.), are essential for global food security as they provide staple food for billions of people and feed livestock. We live in a world where tracking grain production and its supply chain has never been more critical. We are facing a strained supply chain, wars, climate change, and environmental impacts. In such an evolving world, tracking grain production and supply chain with accurate and real-time data is essential for all stakeholders. It helps us avoid food crises, save water and energy, protect the environment, make markets fair and transparent, and create new solutions for better crops. It’s a win-win situation for farmers, consumers, businesses, and the planet.
While the importance of trackable supply of grains is rather obvious, traditional methods of data collection and tracking for grain production lack the required efficiency. These methods are often costly, time-consuming, and labor-intensive, requiring extensive field surveys, sampling, and testing. Such an approach comes with errors, biases, and inconsistencies, due to human factors, measurement uncertainties, and data gaps.
With more satellites in space than ever before, analysis built over satellite imagery provides actionable insights on agricultural land and crops toward assessing grain supply. Sensors acquire optical (like how your eyes see the world!) and radar (if your microwave could see the world!) images of the Earth’s surface at different spatial, temporal, and spectral resolutions. Optical images capture the reflectance of visible and near-infrared light from vegetation, which help us detect crop type, area, health, growth stage, and yield. On the other hand, radar images can penetrate clouds and capture the backscatter of microwave signals from soil and vegetation, which can be used to monitor soil moisture and crop biomass.
Grain Data Solutions analyzes satellite data through various methods and algorithms and estimates seeded acres, crop condition and yield potential. Particularly when dealing with large acreage of land, satellite data offer more accurate and timely information on grain production than ground-based surveys or reports.
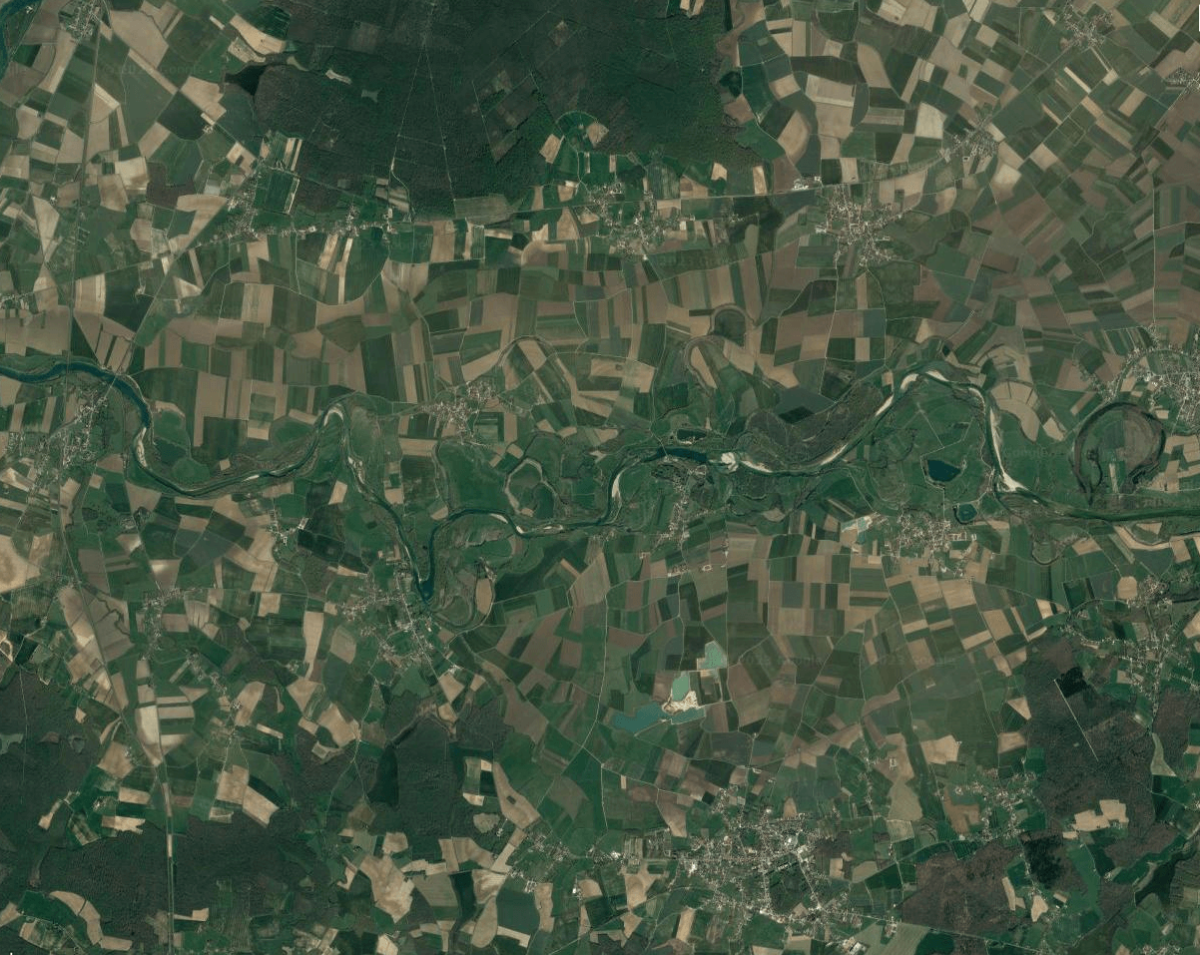
RGB satellite image of grain farms
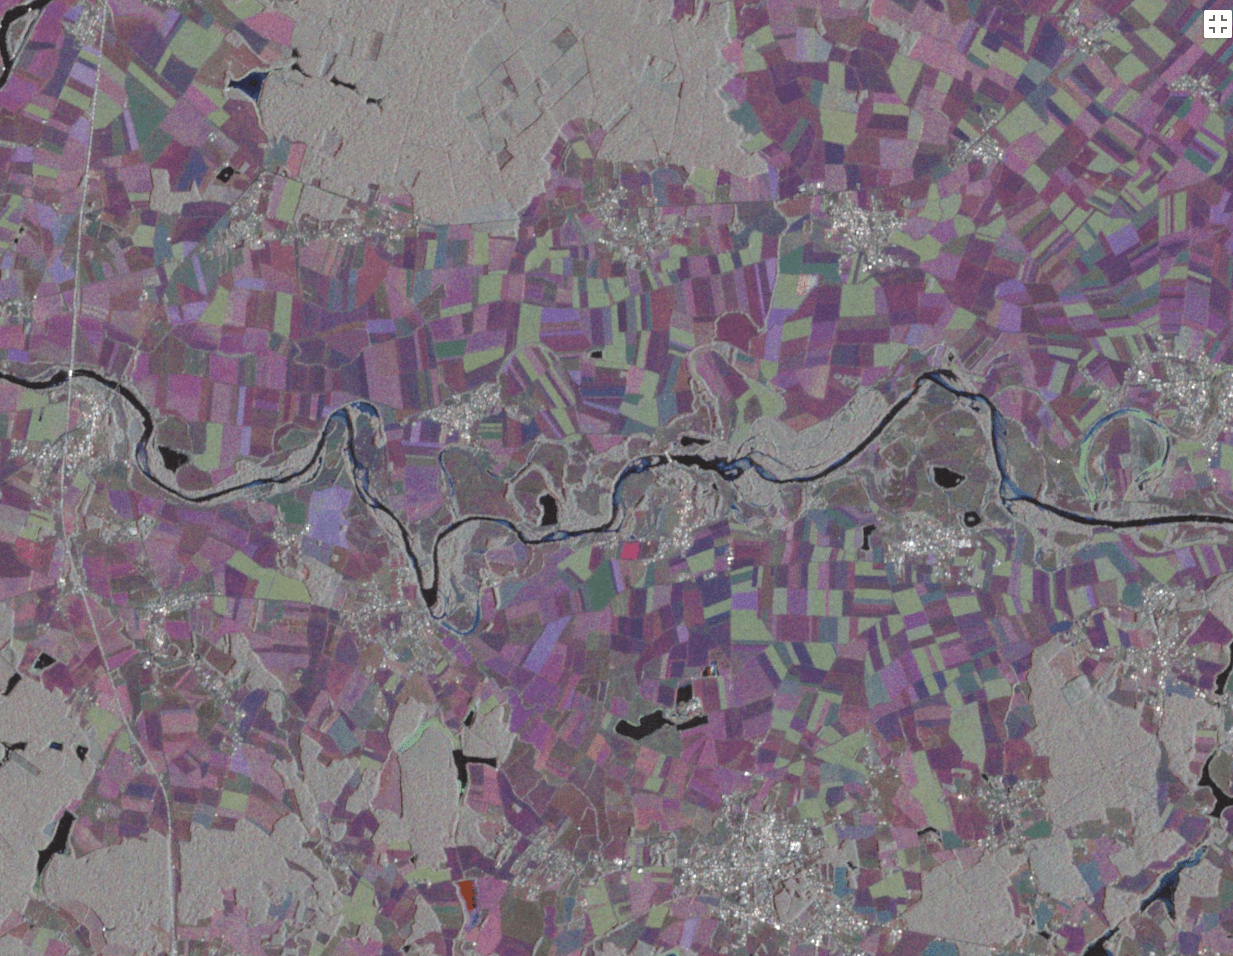
synthetic aperture radar satellite image of grain farms
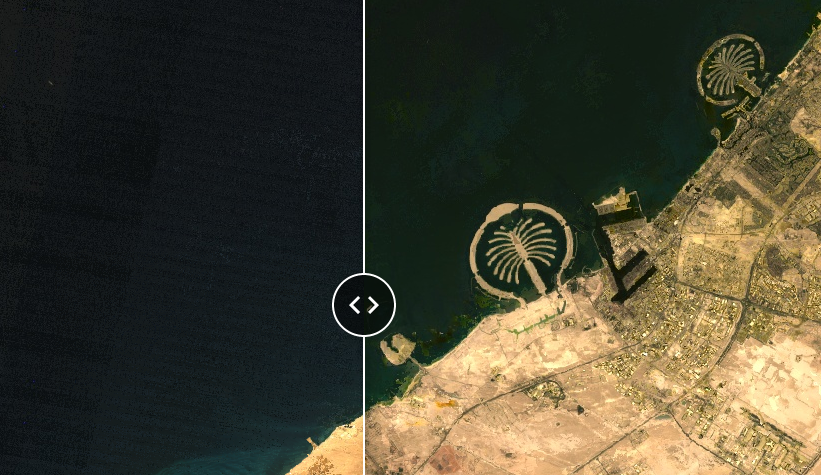
Changes in soy/corn farms from 2019 to 2022 in Wells County, US
How to monitor grain commodities using satellites?
To understand how artificial intelligence can help solve a problem, it’s a good practice to know how a human could solve it. As an example, the problem of crop classification; Let assume you want to detect a soy farm from a corn farm in Nebraska, US, and you have access to satellite images. You’d plot a ground truth time series of corn farms, and soy farms in the area, and you look to see how the farm in question matches any of those. This is called pattern recognition, and that’s something AI is extremely good at, both for the speed and the accuracy.
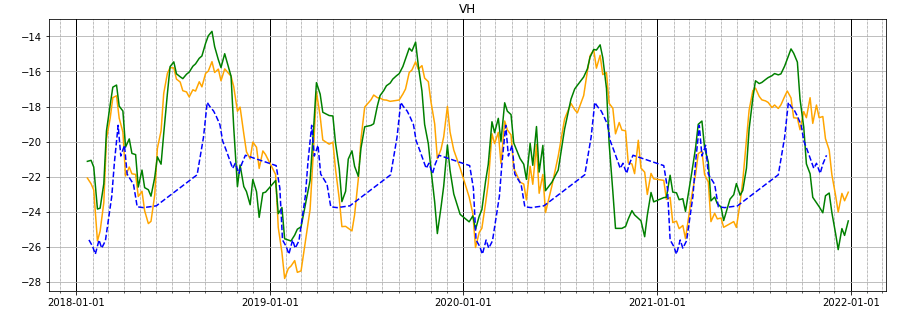
VH pattern from synthetic aperture radar (SAR) satellite data
The graph shows VH pattern from synthetic aperture radar (SAR) satellite data from ground truth data in Nebraska: corn (blue), soy (green), and the unknown farm (orange). What’d be your guess for an unknown farm? Machine learning models find patterns like you, but better and faster!
How do artificial intelligence and AI estimate grain yield?
After we know how many acres of a specific crop is in an area, then it’s about predicting yield. Estimating grain farm yield using satellite images and artificial intelligence involves several steps. The first step is capturing detailed images of agricultural fields, which provides information about crop health and land conditions. These images go through preprocessing to remove any unwanted interference or noise, which in many cases come from clouds of optical data. AI algorithms are then employed to extract relevant features from images, such as vegetation indices and moisture content.
To estimate grain yield, historical yield data is used as training data to build a relationship between the input data and actual yield values. In layman terms, AI models learn the patterns and correlations between different variables. As the model gets trained, it becomes possible to predict grain yield for new and unseen areas based on the extracted features from the satellite data. We improve and validate these predictions using ground-truth data, ensuring their accuracy.
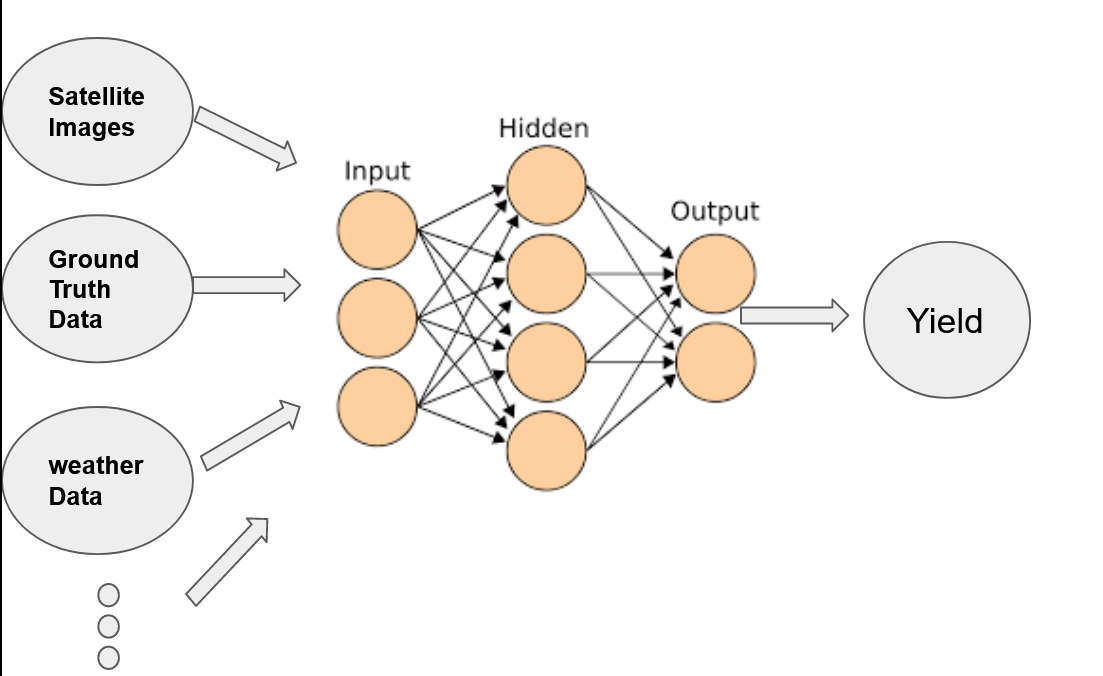
Data science approach to predict yield from satellite images, ground truth data, and weather data
Critical players in grain Data information
Grain commodity data is very valuable insight for stakeholders in the agricultural industry, such as grain traders, food processors, agricultural cooperatives, government agricultural departments, and agricultural research organizations. These entities rely on accurate and up-to-date intelligence on seeded acres and estimated yields to make informed decisions for their grain procurement, storage, transportation, market forecasting and policy development. By leveraging satellite data, these organizations can enhance their operational efficiency, mitigate risks, optimize supply chain management, and contribute to the overall growth and sustainability of the grain industry.
How the grain supply chain tracking could be used?
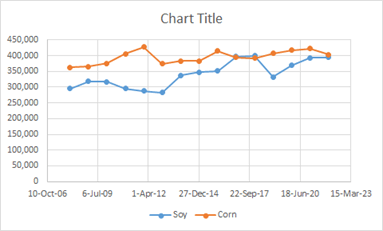
It depends on the scale. Different players in the market need different types of data. While farmers care about the local supply, importers and exporters needs an estimate of global grain supply. Here are how the picture changes based on scale: for example, our analysis shows that for the US, seeded acres of corn farms have been consistent over the past 15 years, but soy farms increased by 32% over the same period, reaching almost the level of acreage of corn.
Seeded acres of corn farms (area under harvest) in the US from 2006 to 2023
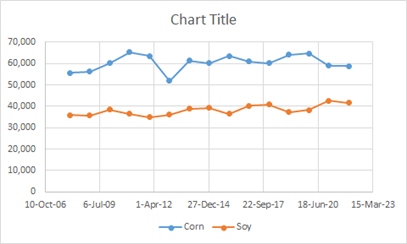
If we zoom in to the State of Iowa for example, we can see a different pattern; while the area of corn farms has not changed much, soy farms increase slightly and consistently.
Seeded acres of corn farms (area under harvest) from 2006 to 2023 in Iowa, US
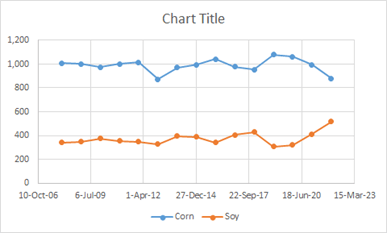
If we further zoom in, for example to Wells County, we see a different recent pattern showing rapid replacement of corn farms with soy from 2019.
Seeded acres of corn farms (area under harvest) from 2006 to 2023 in the Wells County, US
These patterns, whether local or national, have significant implications for grain and food companies, traders, Ag retailers, and eventually consumers.
With the fast technological advancement in remote sensing and artificial intelligence, tracking food supply upstream is feasible more than ever.
Grain Data Solutions provides world class companies with grain market intelligence.
We'd be happy to answer your questions and provide you with information.