6 Ways satellites help farm appraisal and land assessment (scientific and quick!)
If you are on the brink of purchasing or leasing a new plot of land for farming, you need to go through a checklist of formal documents before you finalize that deal. However, there's a crucial agronomic checklist you should consider. Factors such as potential yield and agronomic conditions are vital for farmers, however, accessing such agronomic attributes isn't always straightforward. In this post, we're here to shed light on how satellite images can unveil essential insights about your future farm.
Can satellite images assess farm productivity and soil fertility?
Formal Documents for Farm Appraisal
Missing Documents for Farm Appraisal
Total Acreage
Tillable Acres
Easement on Land
Soil Fertility
Zoning
Precipitation History
Water Rights
Soil Moisture Profile
Roads and Access
Flood Risk
Environmental Regulations
Elevation Map
Previous Use of Land
Yes, satellite images can give you proxies for soil health and potential yield of farms, and the power lies in the abundance of historical data accumulating year after year. Collecting reflection of electromagnetic waves from plants and soil in the range of visible light (RGB), near infrared (NIR) and microwave, you can see how a field performed in the past. Not only the vegetation performance, satellites can reveal critical information such as risk of flood or drought. Over the past few years, satellite imagery for farming has proved to be a game-changer; revealing hidden aspects that traditional maps and documents usually miss. Let’s dive into how to assess a farm with satellite images.
What aspects of the farm assessment checklist can satellites measure?
1. Tillable Acreage
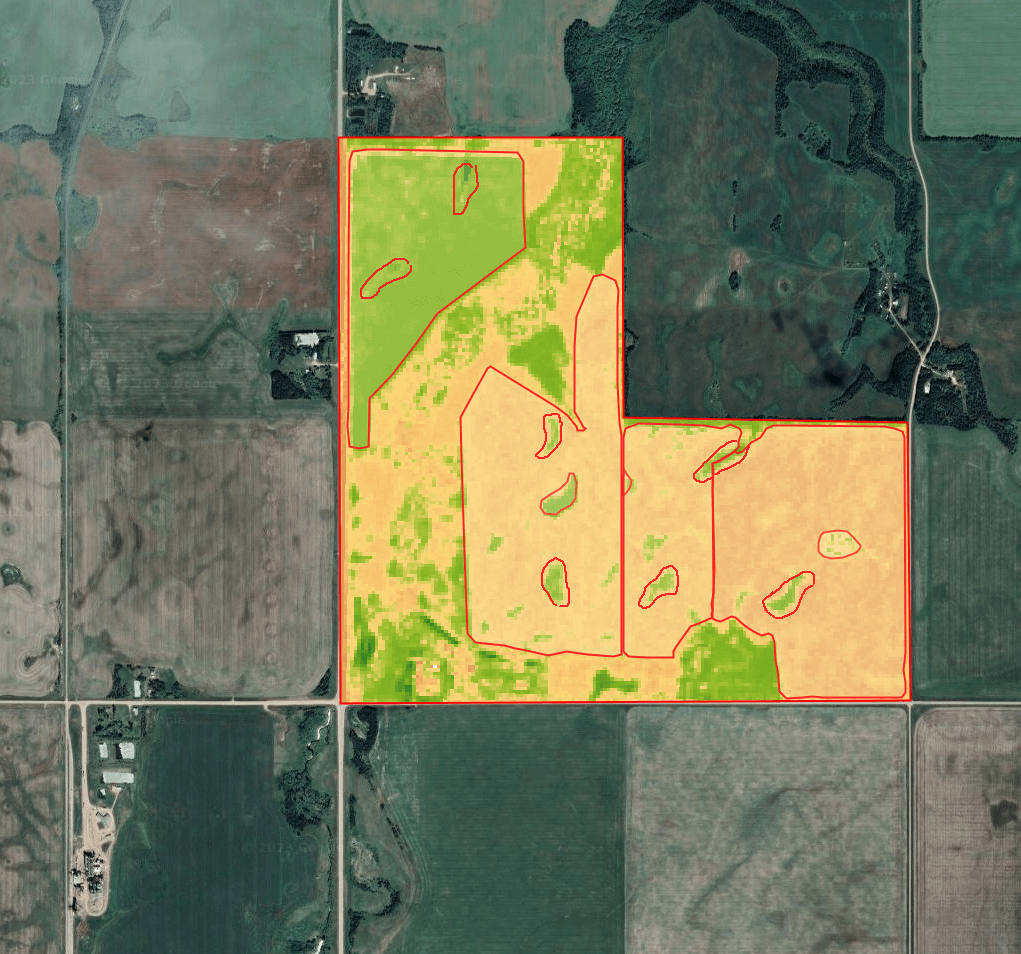
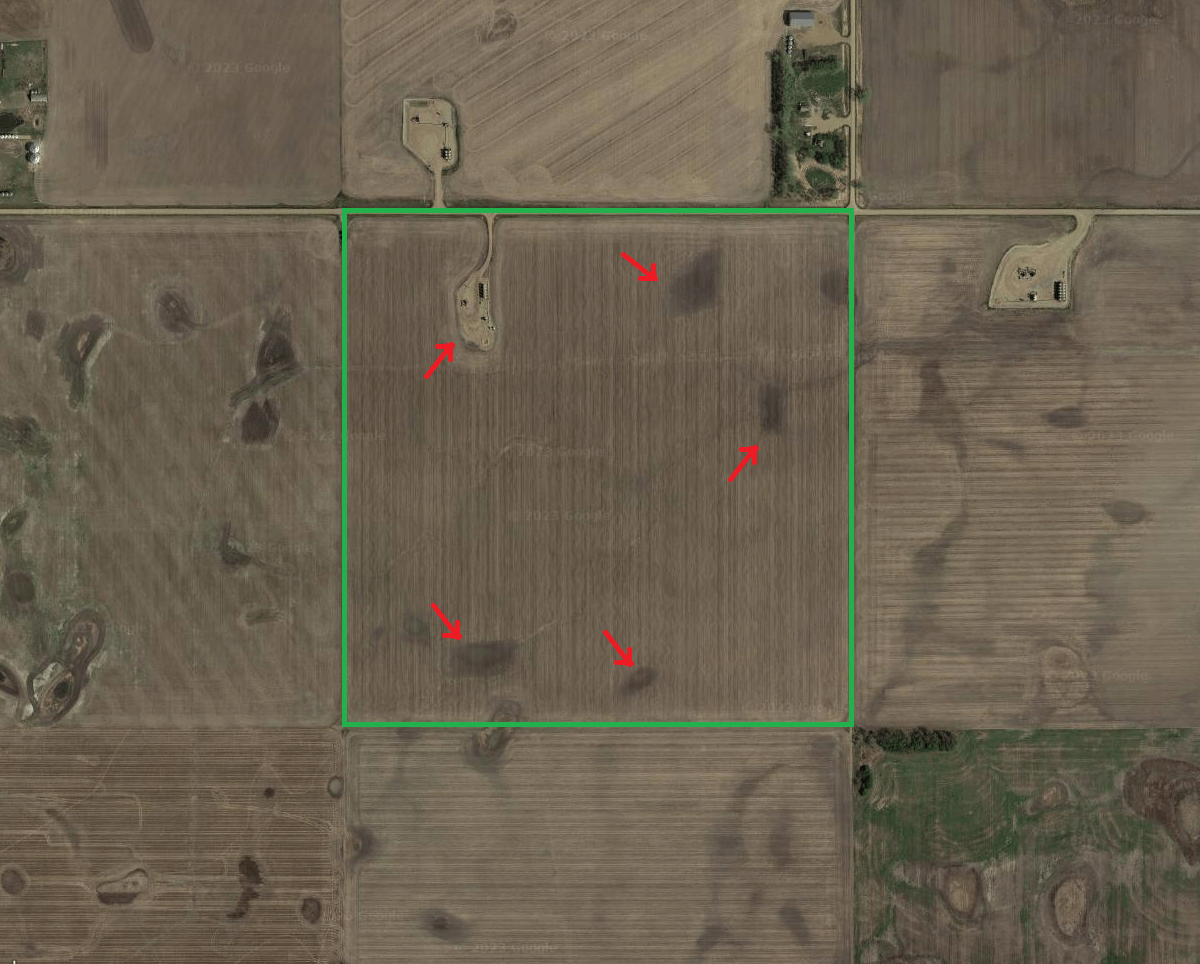
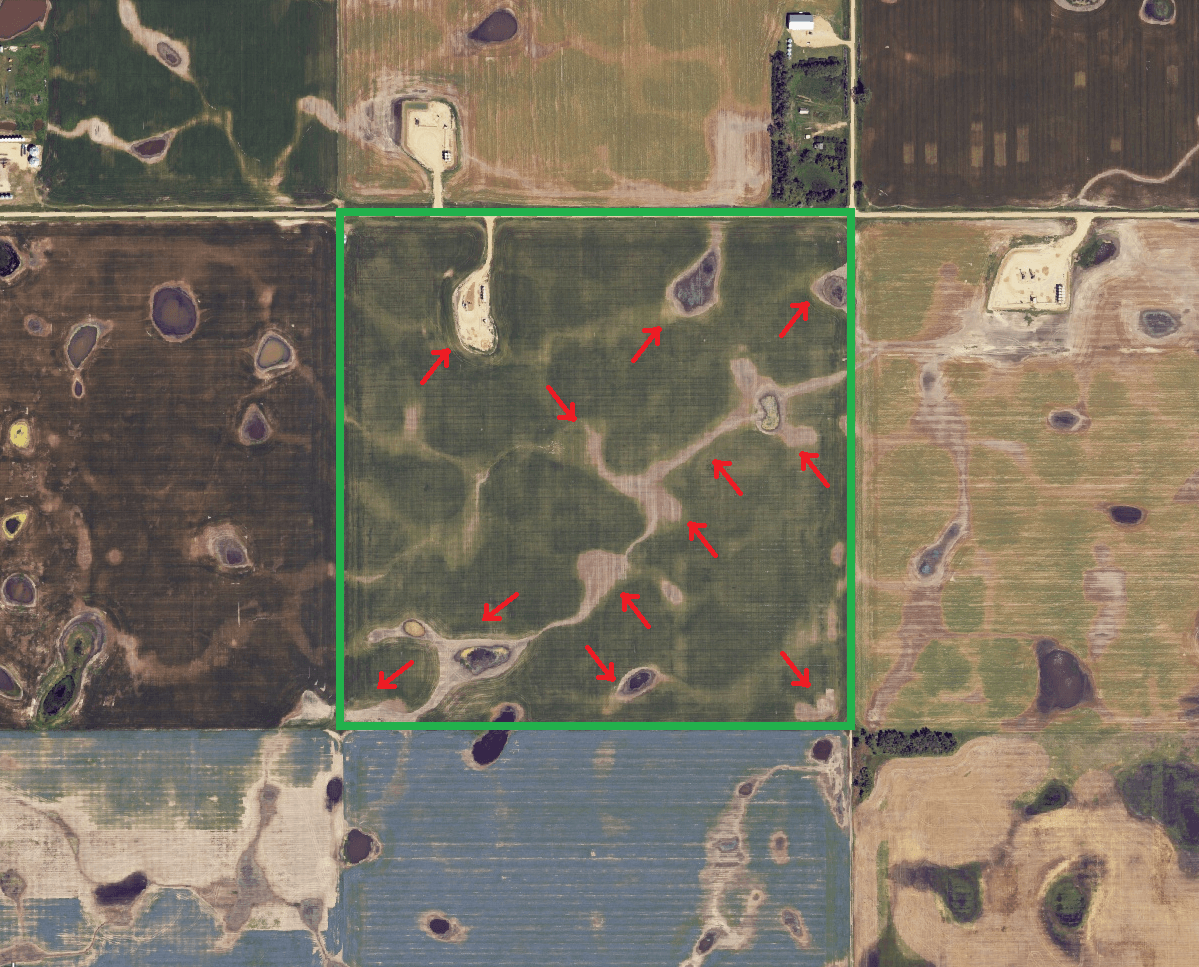
Total acreage of field isn’t the full story. Actual tillable acres, or arable land suitable for crop cultivation, usually are smaller than what the formal documents show due to natural features like wetlands, flooded ditches, or unsuitable soil. Bear in mind that presence of wetlands or other types of natural features has its own ecological benefits particularly because of improving biodiversity in croplands. However, the point is that you should not be surprised by constant accumulation of water in some areas of the farm, you must know in advance.
Natural features such as water ditches, wetlands, or sandy soil can be delineated using satellite images
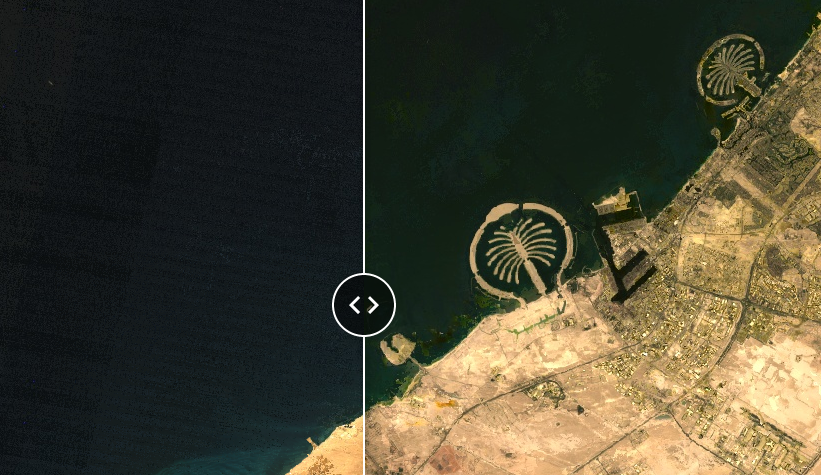
Inconsistent appearances during wet and dry years make these features challenging to spot. As an example, see this farm in Kansas, USA, where Google Map images fall short in showcasing a farm’s evolving status. We leverage multiple high-resolution satellite images to accurately discern non-harvestable areas.
#1
Google map image vs the up-to-date high resolution satellite images of a corn/soy farm in Kansas, USA
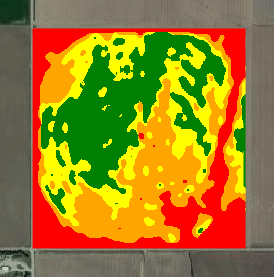
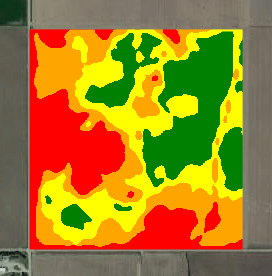
2. Soil Productivity
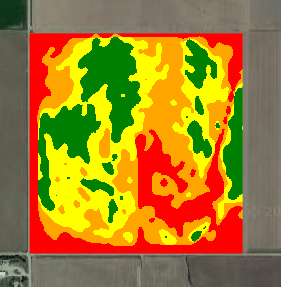
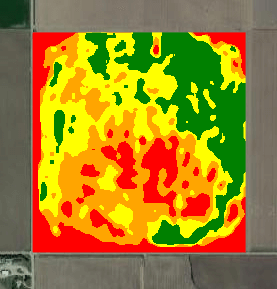
As a farmer would put it, ‘everything starts with soil’. Soil fertility is a cornerstone of successful farming. Knowing productivity across different zones of a farm, both internally and relative to neighboring farms, is paramount. First of all, you need to know different productivity zones of the farm, we have a full post on that aspect; Prescription and yield map from satellite image. Note that soil productivity encompasses fertility, meaning that a fertile soil with good farm management can become productive. What you can see from satellites is the output, or soil productivity, which inherently is affected by its fertility as well.
2018
2019
2020
2021
Farm productivity can change year over year because of crop type and management practices
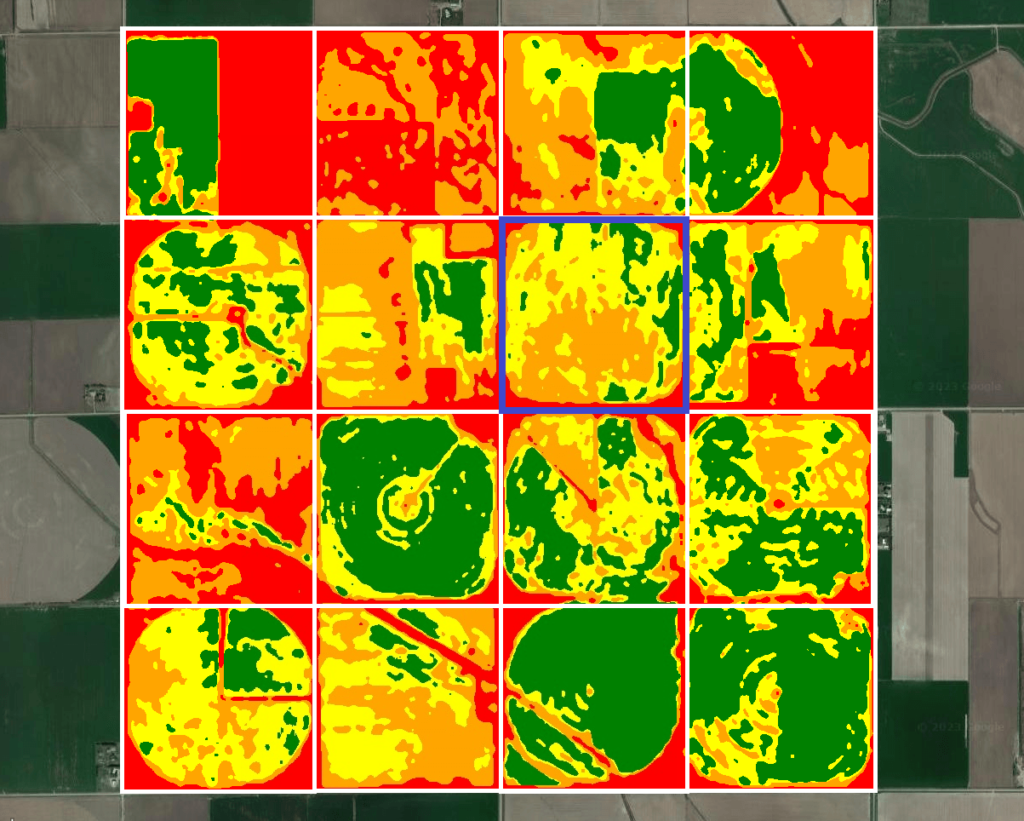
On top of that, you need to know how your farm soil is fertile compared to the neighboring farms. In this way, comparisons cancel out the weather and climate effects, as they are the same of all farms in the area, and just will see how a farm is scored compared to similar farms. Historical satellite images act as benchmarks, enabling insightful comparisons and highlighting variations that exist within croplands.
Satellites can reveal performance of farms in the same area over a period of multiple years.
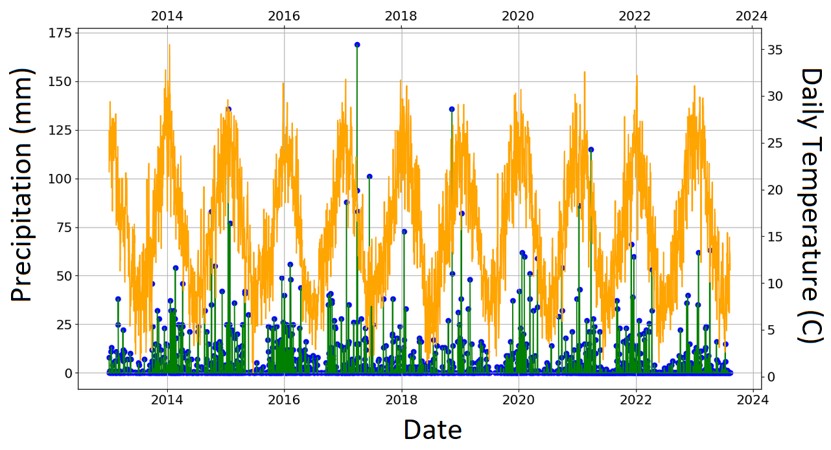
3. Precipitation Patterns
Water availability is a lifeline for agriculture. You need to know the precipitation history of the area. In some cases local governments provide meteorological data accessible to the public. In case not available, we use our weather APIs to provide a comprehensive precipitation history, summer temperature trends, and frost timelines.
A 10 year look back at temperature and precipitation pattern gives you a good picture of what to expect in coming years in the area (area in Western Argentina)
In case your property is irrigated and relies on nearby water sources such as rivers or ponds, you need to know if their water was available as needed particularly in dry seasons. Fortunately, historical satellite images can fully reveal past fluctuations of the water bodies. Comprehensive assessment of availability of water in past years is crucially important because climate change drives more extreme low probability events.
Occasions of river drying up in summer months near Khartoum, Sudan (Sentinel-2 and Sentinel-1 data with water index overlay)
4. Tracking Soil Moisture and Drought History
Moist and dry soil interact differently with electromagnetic waves. This particularly is insightful when using data from synthetic aperture radar (SAR) and active-passive soil moisture (SMAP) satellites. The water moisture (more precisely every single water molecule) in soil interacts with the microwave and thus is reflected back proportional to water content in soil. Leveraging this technology, we offer historical and real time perspective on soil moisture levels in your area. You must be watchful for any extended periods of low soil moisture that indicates potential drought impacts on croplands.
Soil moisture profile and corresponding crop performance in Southern AB, Canada. (source: SMAP profile and vegetation index from Sentinel-2 satellite)
5. Flood Risk
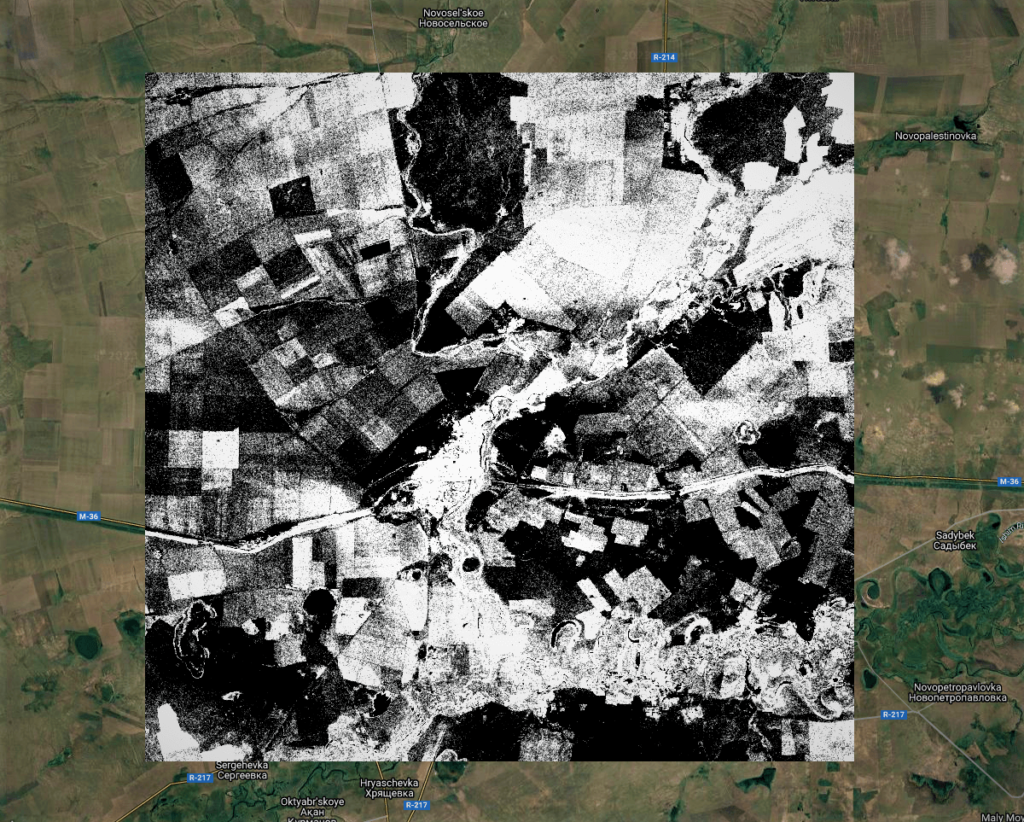
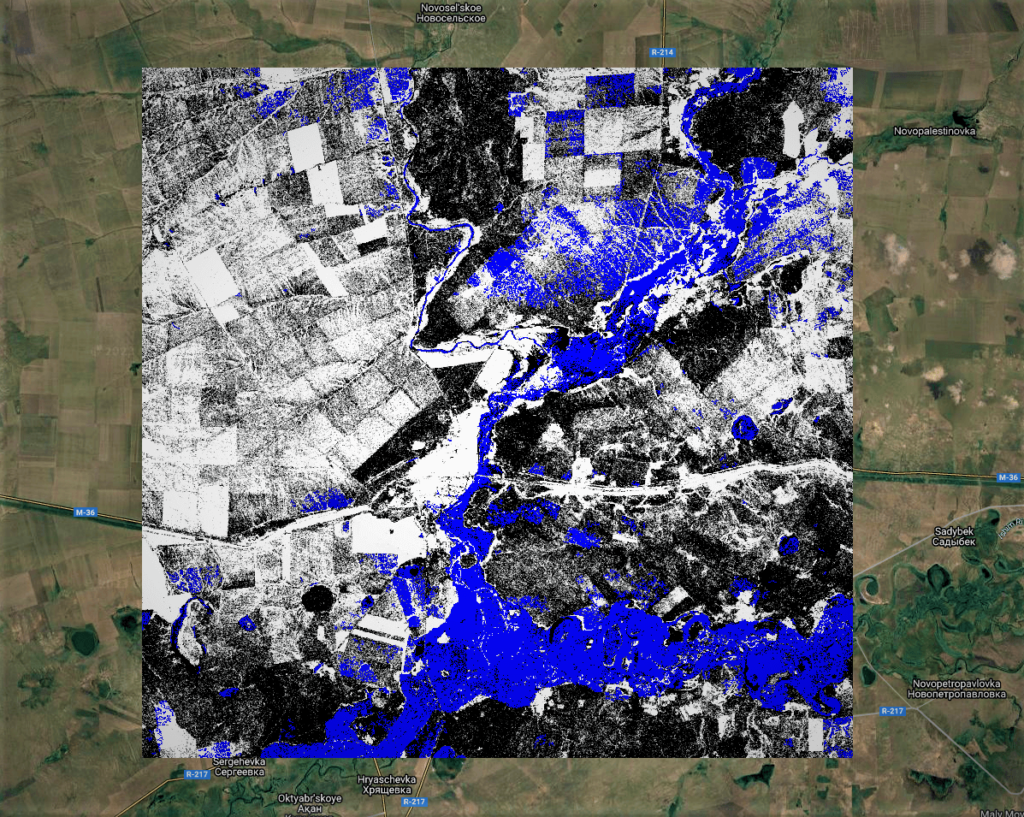
For farm owners and insurers, no other event can be as impactful as flood. While usually extreme large floods grab News attention, flood history isn’t limited to major events. Even minor local accumulations of surface water can wreak havoc on croplands. Using synthetic aperture radar satellites, we detect overflow instances, and we develop risk factors for any given farm considering the elevation and historical meteorological data. The severity of impact varies based on factors like location and terrain slope.
Before flood
After flood
Synthetic aperture radar (SAR) images before and after the flood event showing the area of croplands in Central Kazakhstan damaged by water overflow.
6. Elevation Mapping
You need to know the topography of your farm, and also elevation map in the area where the farm is located. While in very flat areas the effect of slope is negligible, in most croplands Elevation maps hold the key to understanding water runoff, soil erosion, hidden water features, and sunlight exposure. These factors influence crop and livestock management decisions, making elevation data invaluable.
Elevation map and corresponding slope and shade maps in an area in ON, Canada.
Conclusion
In the complex realm of farming, knowledge is power. Satellite images can reveal much about what you need to know about a future farm. Don’t commit to a new farm without having access to essential information.
Our expertise at Grain Data Solutions equips you with the insights you need for informed decisions.
We're here to help you embark on your farming journey with confidence.
If you're ready to assess a plot of land for its true potential, reach out to us at info@graindatasolutions.com.