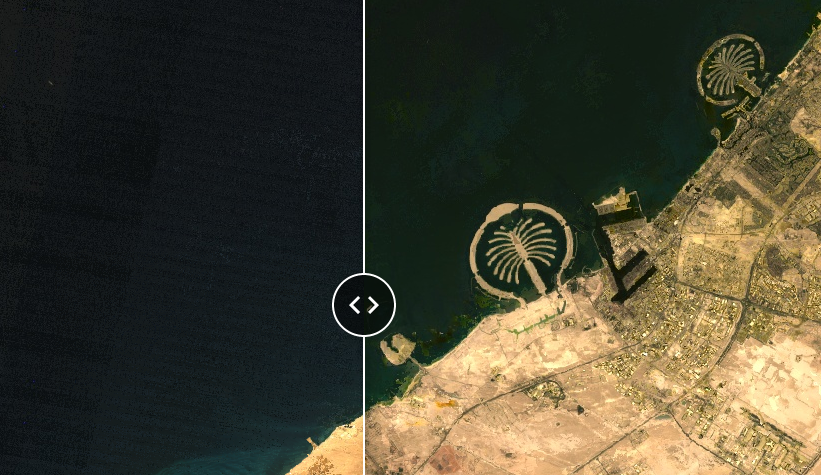
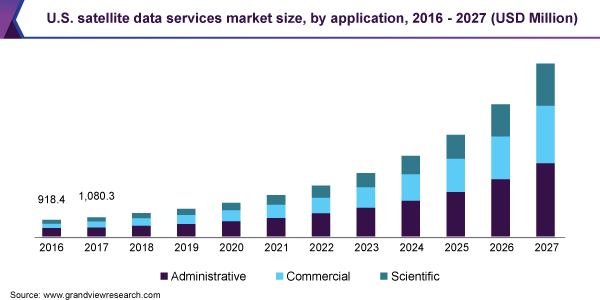
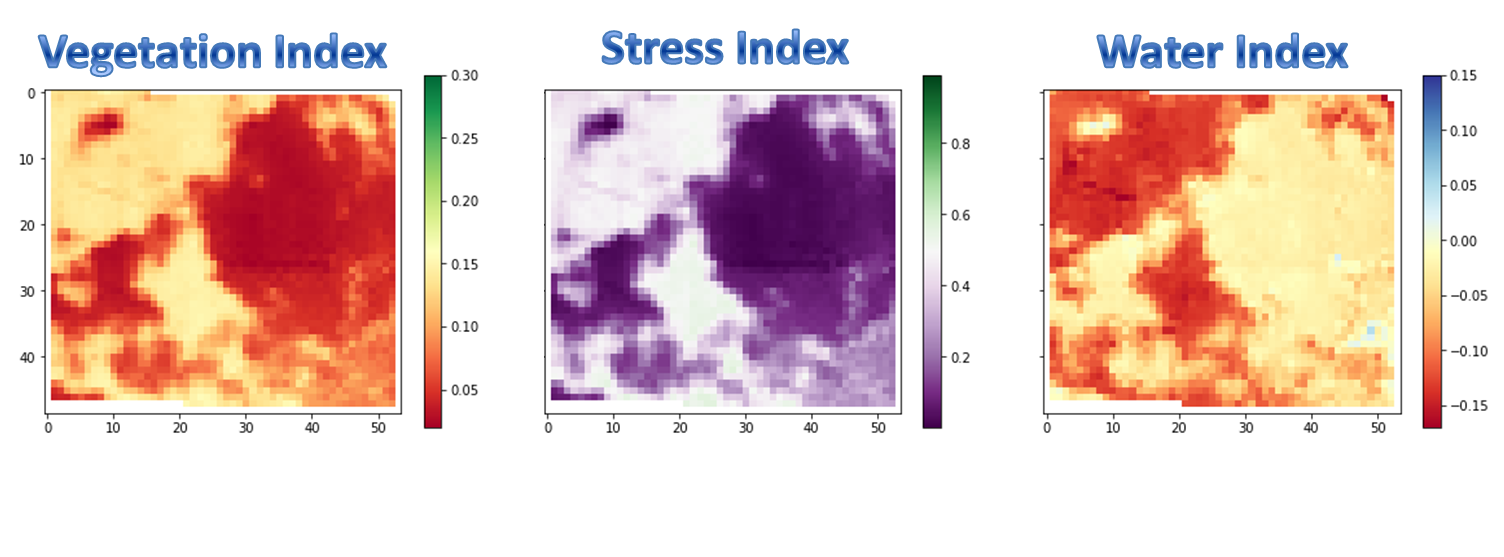
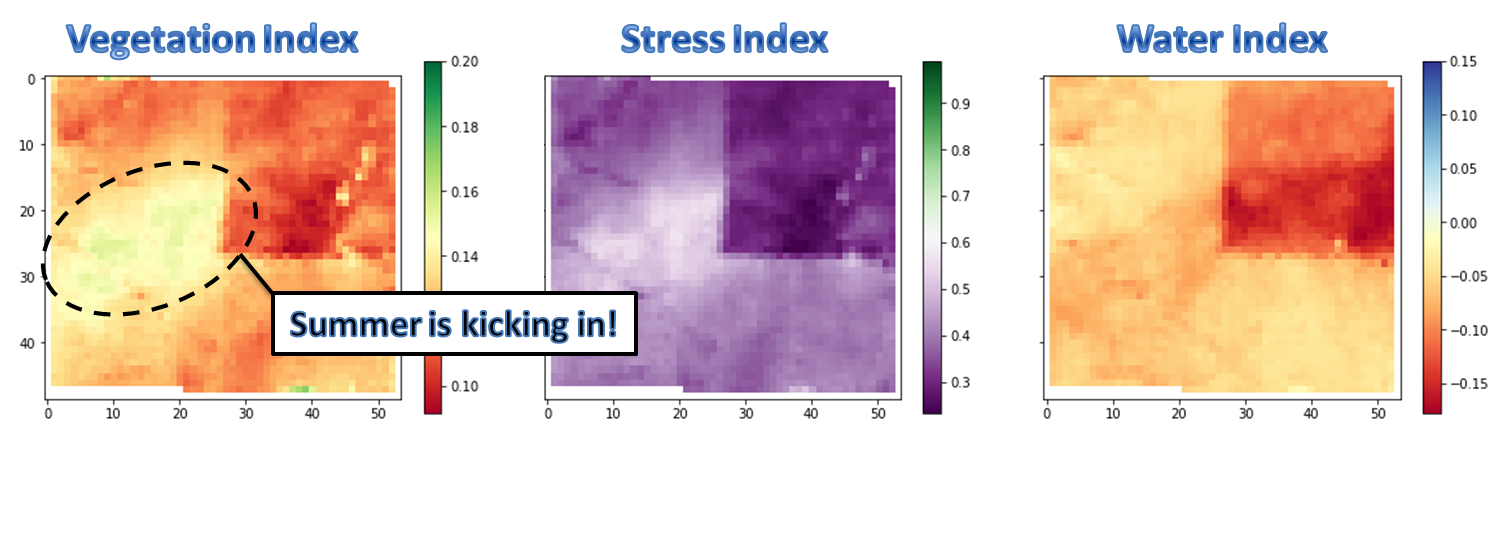
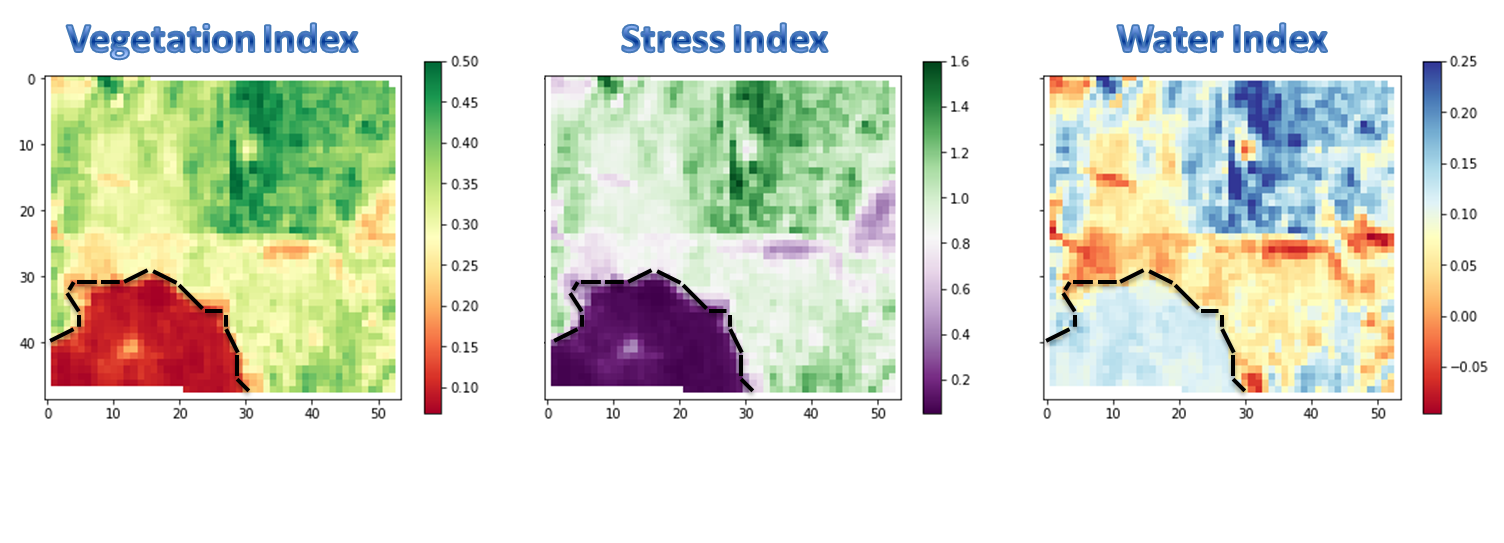
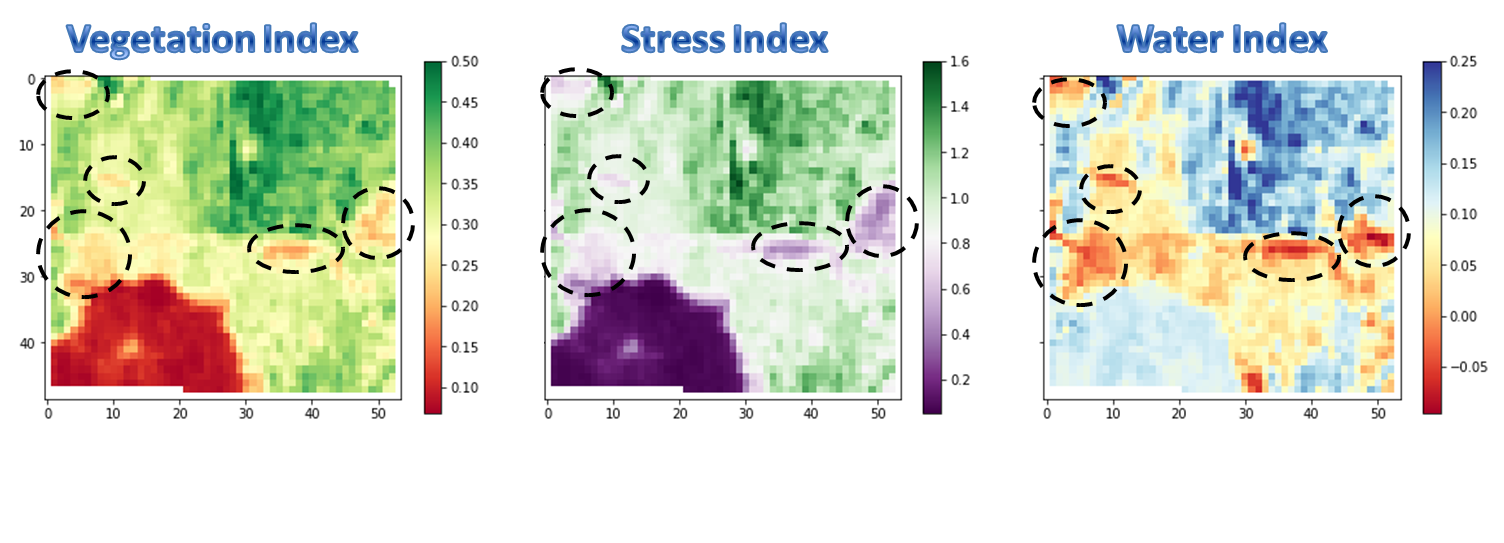
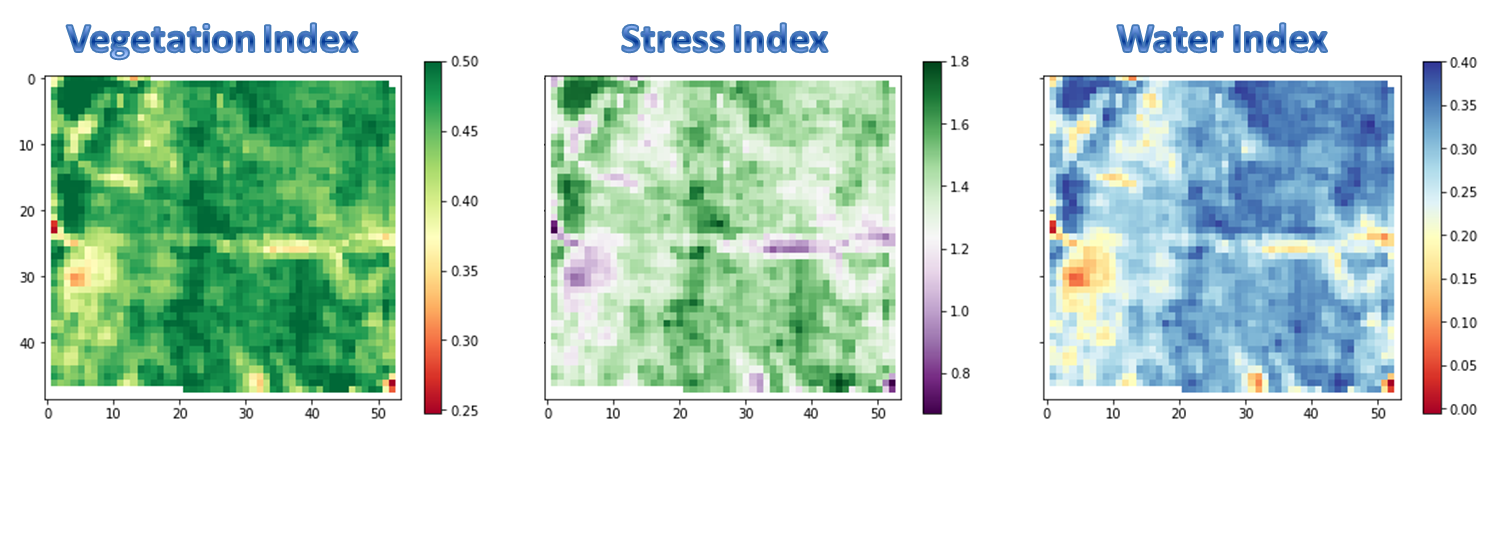
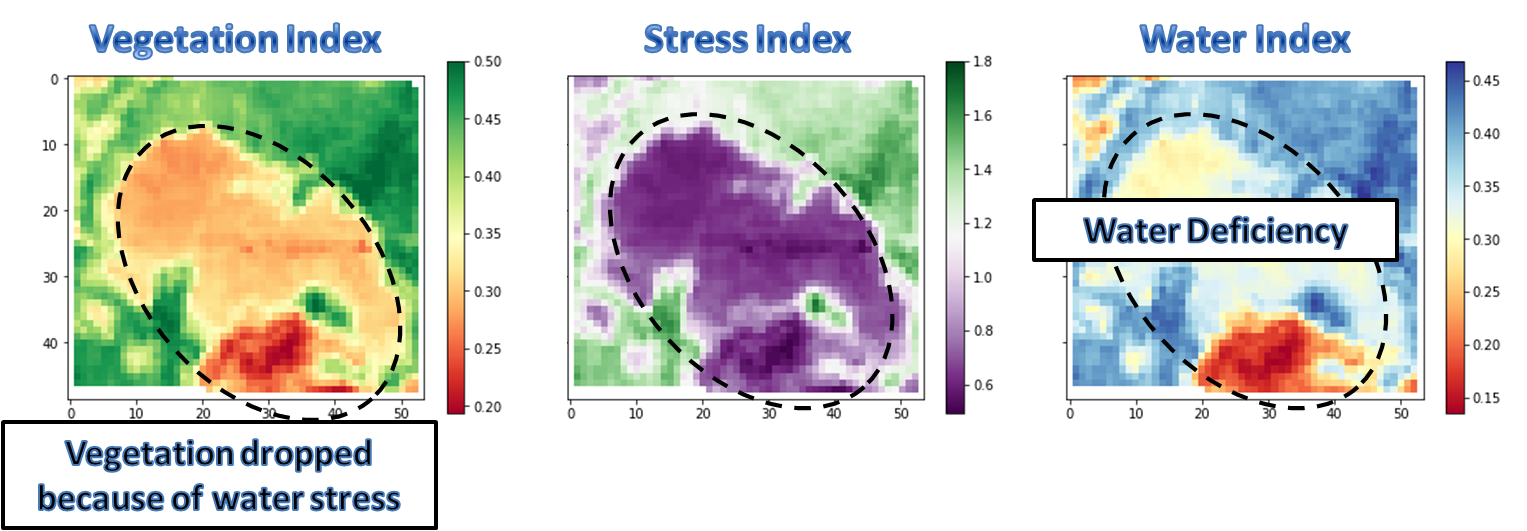
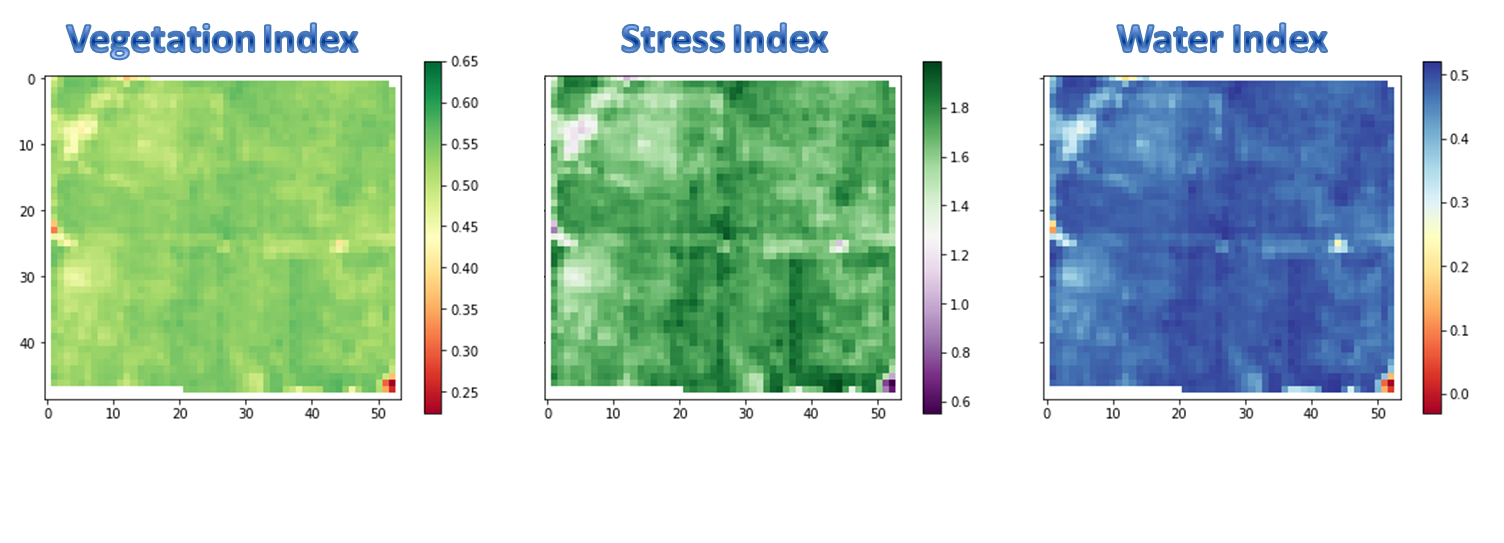
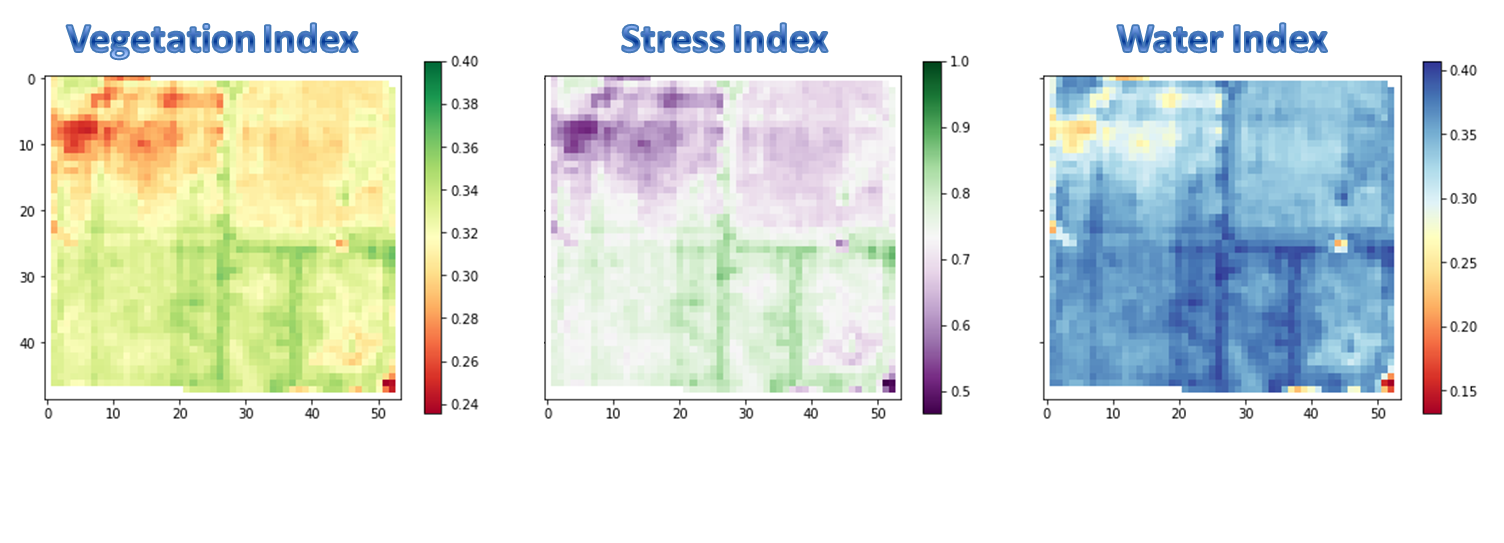
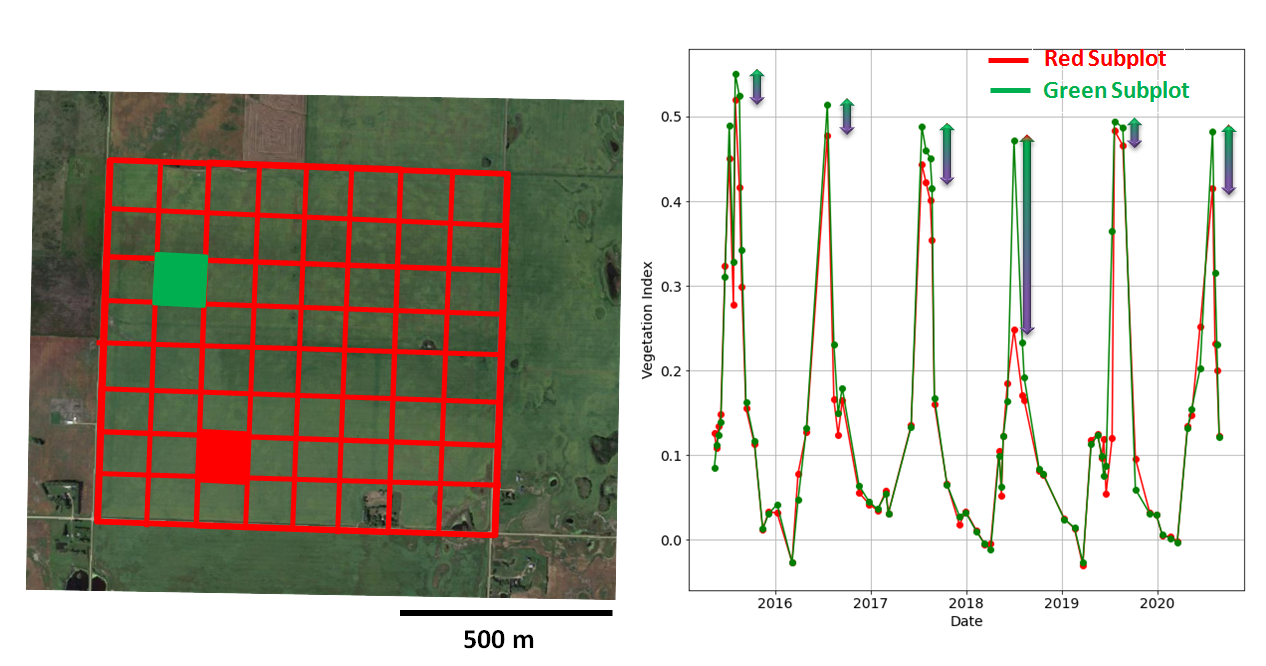
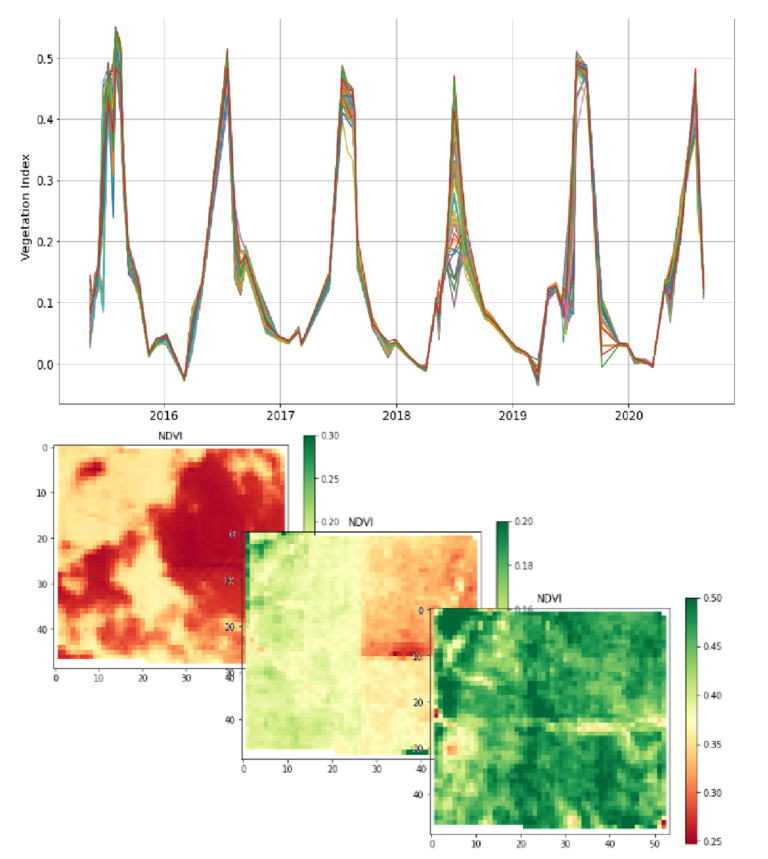
Improvement and availability of satellite imagery in recent years (better spatial, temporal and spectral resolutions) took applicability of remote sensing in precision farming to a whole new level. Satellites are observing earth 24/7, and historical imageries of the farm are available from multiple satellite sources. These new layers of data require further digestions and analysis in order to provide actionable intelligence for farmers. Historical data could give farmers some specific insights about what happened, and how it happened in the farm. Historical data could also be fed to artificial intelligence models to predict what will happen.
satellites for agriculture

How are satellites making agriculture more efficient?

Remote sensing and use of satellites for agriculture are not new topics; however, the use and application of these tools are expanding fast during past few years. Availability of quality data, industrial initiatives for higher return on investment (RoI), and demand for sustainability on the farming level are among the major reasons of utilizing satellites for agriculture. Such a trend started in scientific community but soon expanded to commercial applications:

remote sensing review papers
Number of review papers with ‘remote sensing’ and ‘agriculture’ topics (left); number of citations with ‘remote sensing’ topic
satellite data market size
The expansion in satellite data services is not just about agriculture, but many other industries also increasingly turn to satellite data to solve their problems.

One advantage of satellite data compared to other precision agriculture methods is that the current data is available for almost every farm in around the world whether or not the farmers take advantage of that. On top of that, historical data also is available that could illustrate the trends in farming activities and outputs. Satellites are equipped with multiple bands, and each band collects specific type of electromagnetic wave. Visible light (composed of red, green and blue bands or RGB) conveys practical information about farms, which could be merged with other parts of spectrum to extract useful indexes for farmers and agronomists.

The main principle behind all these satellite farming indexes is that vegetated area and non vegetated area reflect lights in different ways. Similarly, stressed leaf and healthy leaf can be distinguished using ratio of specific bands:

health vs unhealthy vs dead leaves
Healthy leaf reflects more of near infra red (NIR) comparing to stressed leaf. For the dead leaf, on the other hand, the ratio of NIR to RGB is even.
vegetation indexes
Some vegetation indexes to analyze data of satellites for agriculture

A case study of application of satellites for agriculture

Let’s illustrate application of satellites for agriculture with a wheat and canola farm in Saskatchewan, Canada. Knowing the coordinates of the farm, we queried its historical data from mid May 2015 till the end of harvesting season in 2020 -whenever cloud coverage of the scene was less than 30%-.

NDVI, GCI, NDWI indexes
Normalized Difference Vegetation Index (NDVI), Green Chlorophyll Index (GCI), and Normalized Difference Water Index (NDWI)

We evaluated three indexes, Normalized Difference Vegetation Index or (NDVI), Green Chlorophyll Index (or GCI), and Normalized Difference Water Index (NDWI). A low value on NDVI means lack or poor vegetation, for GCI it means plant stress, and for NDWI it means water deficiency on the farm.

NDVI or vegetation index, GCI or stress index, and NDWI or water index in mid May, 2015
NDVI or vegetation index, GCI or stress index, and NDWI or water index in mid May, 2015.

By the end of May, plants are emerging in some areas of the farm.

Satellite imagery analysis could help to locate areas of the farm that affected by stress, for example in late June, the area marked by dashed line shows stress adversely affected vegetation. However, water index shows that this stress is not because of water deficiency.

On the other hand, some spots of the farm show mild stress and delayed vegetation, which directly is the result of lack of water.

2 weeks later situation is much improved, and most of the farm is covered by plants canopy by early July.

NDVI or vegetation index, GCI or stress index, and NDWI or water index in early July, 2015
Analysis of satellite images, also, shows effect of water deficiency stress on vegetation.

For example in this farm, around late July water deficiency significantly affected plants and reduced vegetation.

This water deficiency was over by next week, and plants recovered fast.

From there, it’s the end of summer, and harvesting is close.

By mid September, the farm is entering the winter mood.

In winter seasons, all indexes show low value due to lack of vegetation and water on the farm.

We plotted the historical vegetation index of the farm. Each data point in the graph is the average of NDVI of the farm for the date satellite image was taken.

Performance of the farm as a whole average vs. segmented subplots

This graph is an average over farm, but the farm could be segmented to many subplots and each subplot has its own performance history:

NDVI trend for subplots of the farm from 2015 to 2020
NDVI values for each of the subplots of the farm

Performances of subplots are not the same. Some show consistent under or over performance compared to others. For example here the subplot highlighted in green consistently over performed the one highlighted in red.

NDVI for diferent sub-plots of the farm
Comparing the NDVI for two specific sub-plots of the farm

Here is another example.

NDVI for diferent sub-plots of the farm
The green subplot over-performed the red ones every year

Each subplot could be as small as only one pixel of the satellite image which corresponds to 10 meter by 10 meter area on farm scale.

Each historical curve from each pixel or subplot indicates its future performance. Although such a data is overwhelming for the human mind, artificial intelligence models can digest and extract hidden patterns out of that. Knowing what happened in farm is not just about learning from history, but also predicting the future and taking a proactive approach. We feed historical values from satellite imagery and use artificial intelligence and time series analysis to predict performance of farms as whole, or on the subplots as small as pixel size in satellite image.

Here is a video that summarizes this case study in application of satellites for agriculture.

Let’s get in touch and discuss a specific use case of artificial intelligence and satellites for your agribusiness.

If you found this post insightful, please share it on social media!

Sign up for our Newsletter