Satellite Imagery Gallery
Unlocking Insights with Satellite Imagery and AI Technology
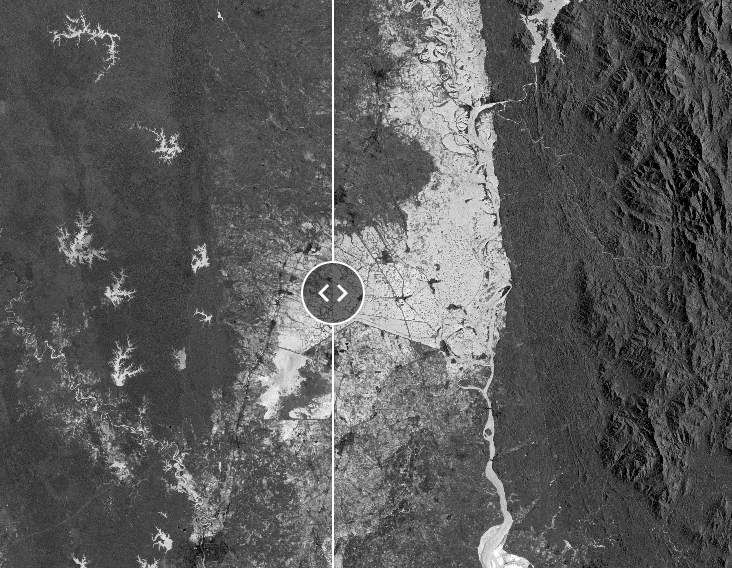
Flood Damage Extent using SAR
Choose an image to visualize and Drag slider to the left and right!
In many places in the world, weeks can pass without a single clear day, and that’s a huge issue for detecting natural disasters by satellites based on visible light that cannot penetrate clouds. Microwave based wave or Synthetic Aperture Radar (SAR) clearly detects water from other land covers, and is not blocked by clouds.
(Myanmar Flood during Monsoon season in 2018)
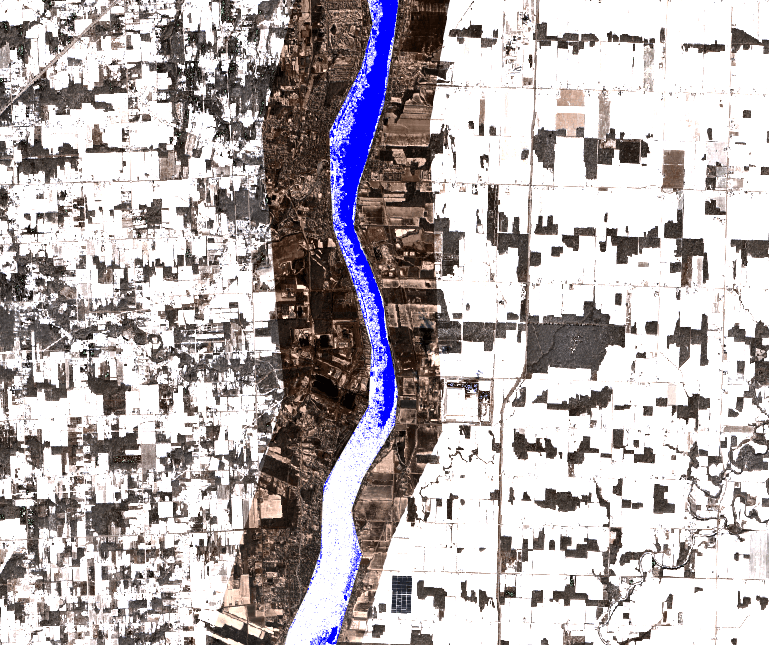
Ice Jam Detection by SAR
Drag slider to the left and right!
Detection of ice jam (white) from water (blue) using Synthetic Aperture Radar (SAR) satellites and machine learning classification on top of that. The ice-jam build up is a major factor in water overflow and subsequent flooding in the St. Clair River (Ontario, Canada), and many other rivers in North America.
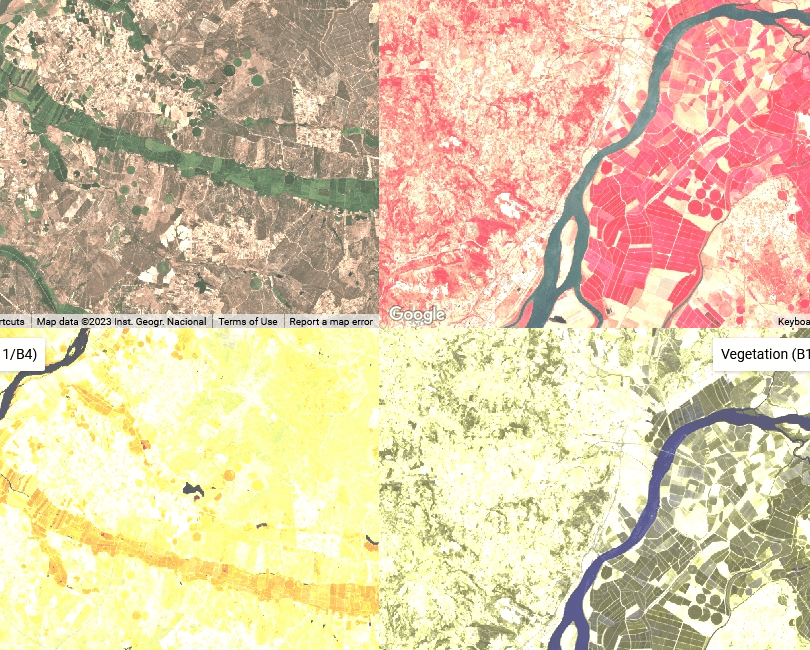
Beyond Visible Light
Zoom in and out!
We see the world through a combination of red, green and blue (RGB) lights, but there is much more to gain from electromagnetic waves. A combination of RGB, Near Infra Red (NIR) and Short Wave Infra Red (SWIR) spectrum with AI on top of that could reveal more aspects of vegetation, soils and water bodies.
(Irrigated farmland near Lisbon, Portugal)
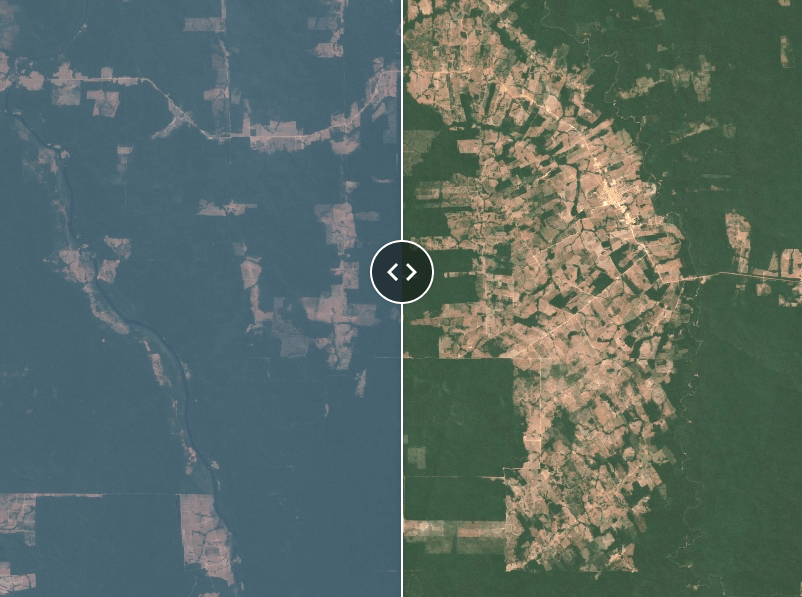
Detecting & Predicting Deforestation
Drag slider to the left and right!
Satellite imagery coupled with AI holds immense potential in combating deforestation. By monitoring forests from space, we can detect illegal logging, land clearance, and other threats to these vital ecosystems with unprecedented precision and speed. AI algorithms can sift through massive datasets, flag areas of concern, and even predict future deforestation hotspots.
(Deforestation in northern Mato Grosso, Brazil: left image: Aug 2016, right image: Aug 2023)
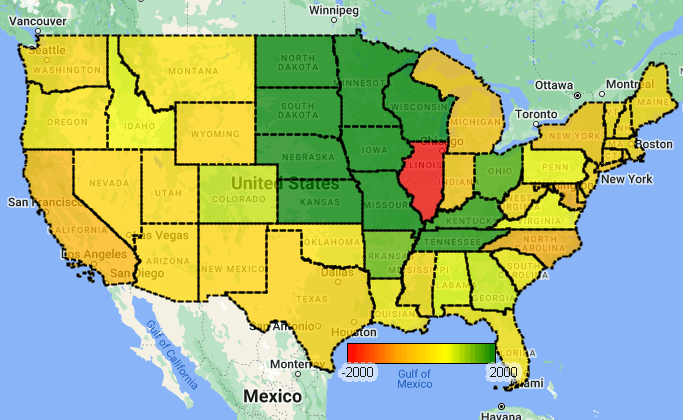
Land Cover/Land Use Analysis
Tab on "Click me!" button and wait to see the graph!
Land cover and land use (LC-LU) analysis is crucial for understanding how our world is changing. The combination of satellite imagery and AI is revolutionizing LC-LU assessment by allowing us to analyze vast regions quickly and accurately. On the right panel select land-use type and year and hit ‘click me’. The graph shows the change in land use over all states in the US. The map (Give it a while to calculate!) shows gain or loss for that specific land use for each state. This analysis cover 2000-2023, 100 different land cover and land use, and granular to county or sub-county level.
(2000-2023 USA)
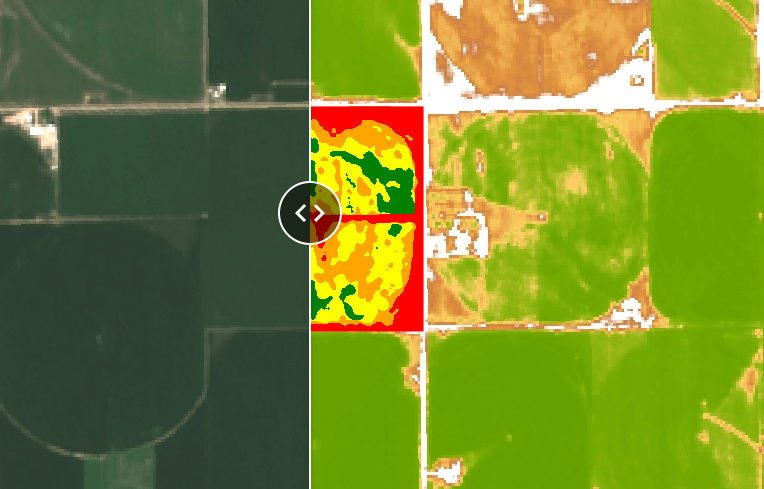
Identifyig Productivity Zones
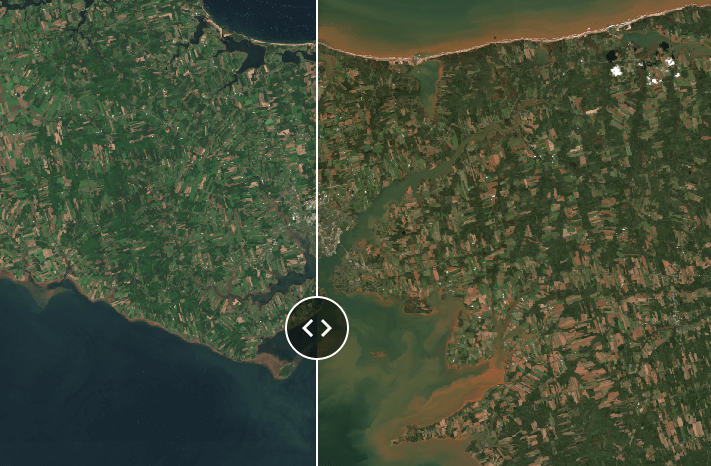
Hurricane Impact Assessment
Drag slider to the left and right!
Natural disasters could have an immediate and severe impact on shoreline natural habitat. Swipe the cursor to the right and left to see the effect of hurricane Fiona on P.E.I (Sep 2022) before and after the event. Note the change in colour of water as the seabed is disturbed by hurricane.
(Hurricane Fiona, P.E.I, Canada – Sep 2022)
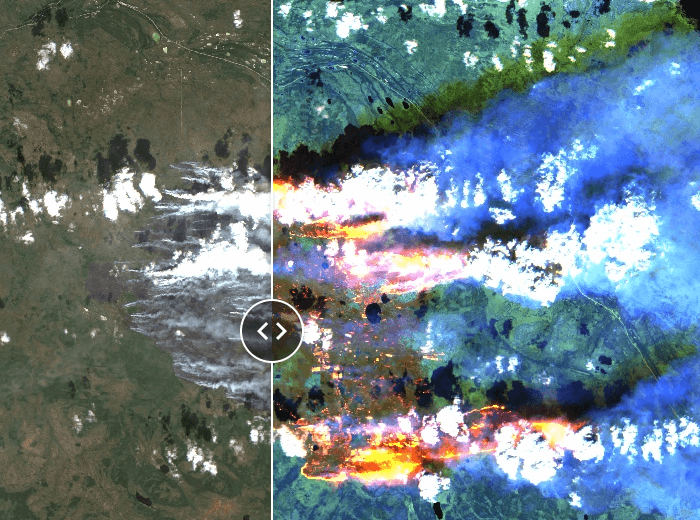
Wildfire Mitigation
Drag slider to the left and right!
Near Infra Red (NIR), Short Wave Infra Red (SWIR) spectrum and Infra Red (IR) spectrum are not easily blocked by clouds, haze or smoke, and can clearly detect pockets of flames in wildfires.
(Aug 2023 Wildfires in Northern Canada)