Data science has a great potential to add values to the agriculture sector. Applying data science in agriculture includes two major sections; data analytics and machine learning. This post brings real examples of how to use data analytics to visualize main effects and interactions. It, also, provides practical applications of predictive analytics and machine learning for yield and severity of diseases in wheat.
Artificial intelligence and data science are changing the world we live in. Every major industry adopted or prepares for adopting data science as the backbone for data driven approaches, and agriculture is not an exception. Applications of big data and data analytics are expanding in the agriculture sector. One of the most important applications of data science in agriculture is the prediction power of the machine learning (ML) algorithms. This case study aims to illustrate the power of data science in agriculture and specifically in farming, and its practical limits, in predicting the yield and severity of diseases of wheat.
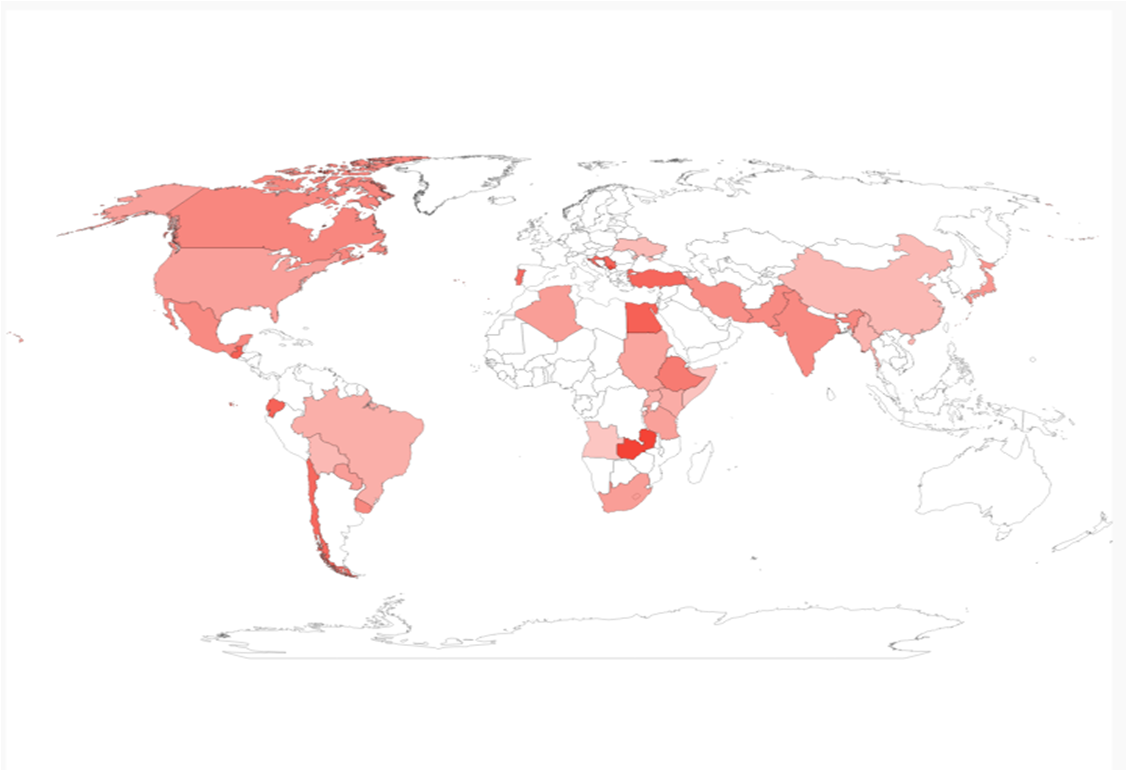
We use an open source data from CIMMYT on trials of 50 different wheat lines, and we examined the data that was collected from 2012 to 2019 in 120 different locations in 37 countries.
Map of countries attended in the trial with their average yield of wheat as intensity of colors (0.9-8.8 t/ac)
The original data (from merging multiple files) had 131,932 rows and 17 columns (attributes). After cleaning and pivoting on unique trials, we ended up with a data set of 23280 rows (each row a unique farming experiment) and 155 columns (each column explains an attribute of that farming experiment).
Data Analytics in Agriculture
Data analytics is about getting to know your data and preparing it for models. For any project on application of data science in agriculture, or any data science project in general, exploratory data analysis (EDA) is the crucial first step. EDA deals with presenting the insights from data in form of graphs, charts and statistical analysis. This helps understanding the features in data, possible correlations and trends, which in business term is also called descriptive analytics.
In most applications of data science in agriculture, the machine learning model is just the tip of the iceberg, the better part of the work is around cleaning, understanding, preparing and manipulating data to be fed to a model.
Among 155 columns some were output such as grain yield, and some were input. Inputs varied from controlled independent (e.g. amount of fertilizer) and uncontrolled independent (e.g. precipitation) to uncontrolled dependent (e.g. severity of diseases). Also, some of the columns were considered junk for our purpose (e.g. email address of the contact person in charge of experiment).
For the EDA we focused on the visualization of the main features and also the interaction between features.
a. Visualization of Main Features
We cannot visualize all of the features in this post, but some of the important features from each category are presented to get a sense of the data set.
Yield, 1000-grain weight, agronomic score and time-length of farming in wheat
Amount of N, P, K for the first round of fertilizer, N for the second round of fertilizer, accumulated precipitation, space between rows, sowing month, and harvest month and year for trials.
The number of farms affected by different percentage of yellow rust, leaf rust, and lodging. Graphs are highly skewed to left meaning most of the farms did not report any significant issue.
Insect and weed problems were the most common type of damages affected the wheat farms.
Foliar disease had been a widespread problem compared to root or spike disease in wheat farms
Considering many farms did not collect data for some of the attributes, null values were present in most of the features. Accordingly for most features, the total number of valid values is smaller than the entire number of farming trials.
b. Interaction Between Features
One of the most important tasks of data analytics projects is to find statistically meaningful correlations between inputs and outputs in data. However, this task could become complex if there are many features in datasets with interactions. And, this is a use case of data science in agriculture because a good number of attributes affects both outputs and other inputs. For example, weed and insect problems adversely affect the yield. While we would like to model the effect of each attribute independently, the interaction between these features makes it a complex problem; i.e. presence of weed could affect presence of insects, and vice versa, and both could affect the yield. As another example the graphs below show the effect of added phosphate on leaf rust, yield and plant height. One would expect strong trends, considering fertilizers are likely the biggest expense a farmer has on a per-acre basis. These graphs do not undermine the proven effects of phosphate, rather it points out to other attributes that undo/overshadow that effect. It also highlights the issue of applying of too much fertilizer where it was not needed.
Effect of amount of phosphate fertilizer on height, yield and leaf rust spread in wheat farms
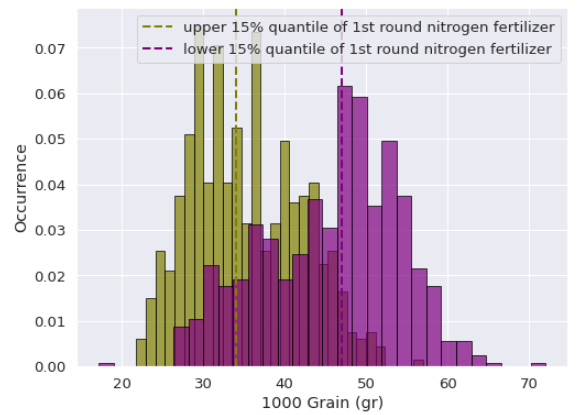
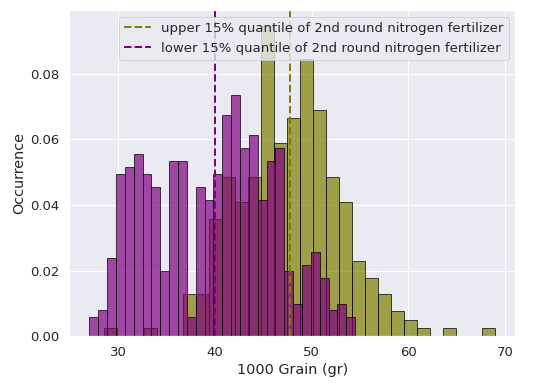
To further illustrate the complexity of otherwise ‘well established’ task of adding fertilizers, these graphs show the effect of adding high and low amount of nitrogen fertilizers on the first and second round of fertilizing.
Among the farmers who added fertilizers for the first round, some added for the second and third rounds as well. The graph compares weight of 1000-grain for top 15% and bottom 15% amount of nitrogen fertilizer added in first and second rounds. In the first round, farmers who added relatively high amount of nitrogen (top 15% quartile) adversely affected the size of grains obtained from their farms (left image). On the other hand, high nitrogen fertilizer improved grain quality on the second round compared to those who added too little or no nitrogen fertilizer (bottom 15% quartile).
Distribution of 1000-grain weight based on amount of N fertilizer in 1st and 2nd round. Dotted lines represent median value of the distributions (P-value < 0.01)
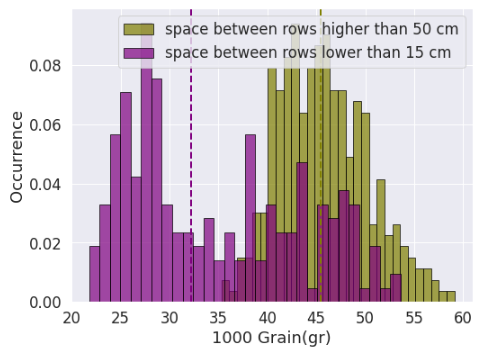
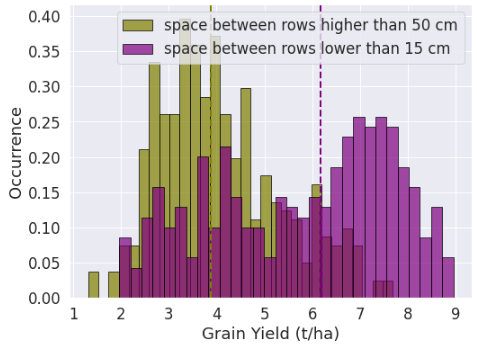
Effect of space between rows on the 1000-grain weight and yield; The dotted line represents the median value of the distribution.
The variance in the inputs determine to what extent they play a role in the outputs. On top of that, some features are inherently more important. For example the variance in soil moisture plays a critical role on yield, while variance in wind direction does not have such impact. This is where variation in one important attribute could totally overshadow changes in less important ones. See the effect of space between rows (higher than 50 cm or lower than 15 cm) on the yield and the 1000-grain weight. In both case the p value is much smaller than 0.01.
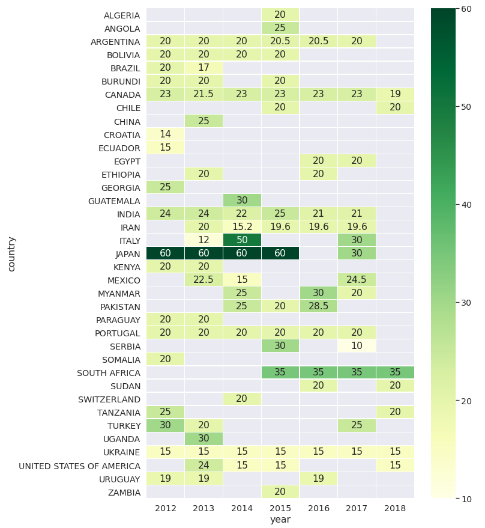
The space between rows shows that each country followed a protocol (for farming practice) that could be radically different from other countries. For example, the average space between rows for Ukraine was almost half of South Africa’s, which was almost half of Japan’s.
Space between rows (cm) applied in wheat farms in different participated countries
Following different farming practices, in addition to environmental factors, resulted in outputs that were affected more by location rather than genes.
The case of large complex datasets with a high number of attributes is where statistical tools and data analytics, though essential initial steps, are not enough to drive predictive insights. That is where machine learning models play a critical role as predictive analysis tools.
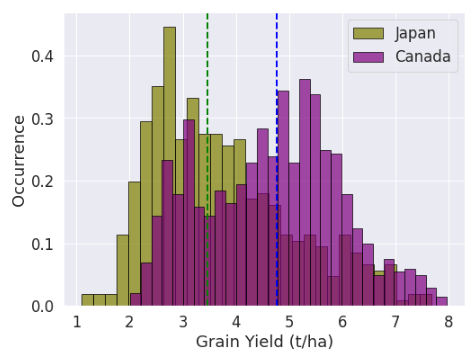
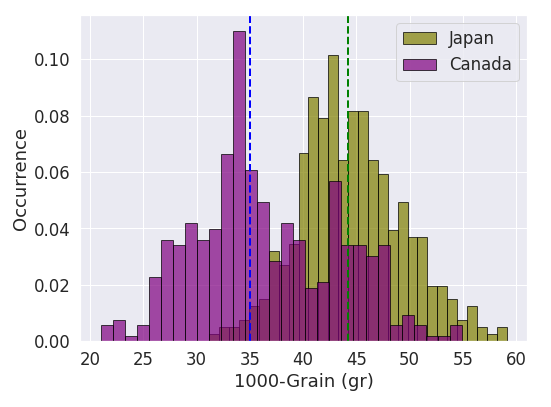
The distributions of yield and 1000-grain weight for wheat farmed in Canada and Japan
Machine Learning in Agriculture
Data science in agriculture is about taking the wealth of insights extracted from data analytics techniques to the next level and provides predictability using machine learning algorithms. This approach provides deeper insight in understanding and using farming data. In spite of huge potential of application of data science in agriculture, its practical applications on industry levels are relatively limited. In this case study, we show the capability of data science in predicting yield and diseases severity of wheat, and focus on the most important features in prediction.
1. Predicting Yield in Wheat
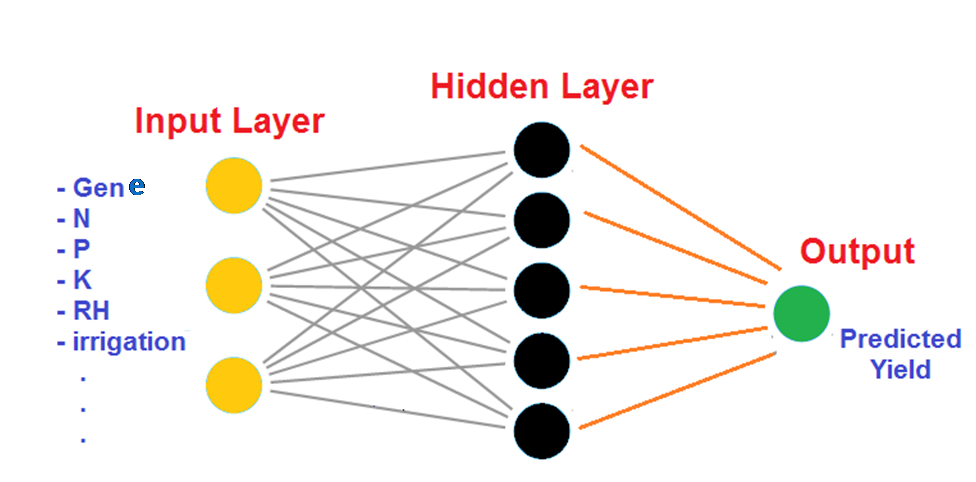
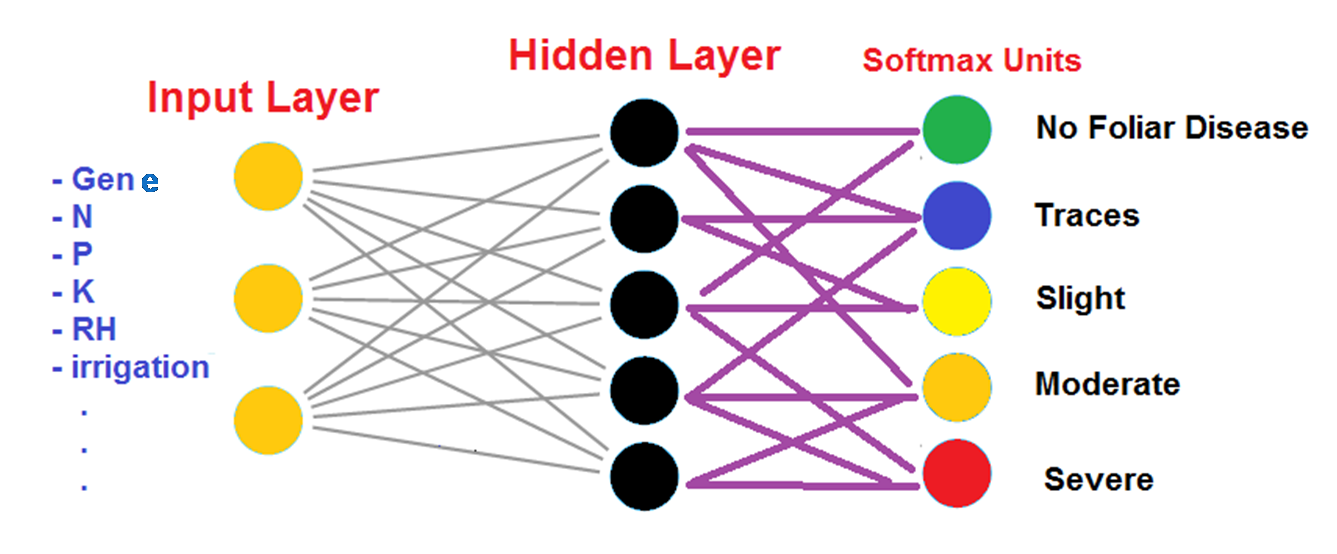
In data science, the supervised machine learning is applicable when dataset has labels. Labels are what the ML model learns to predict. In this case, labels could be yield, 1000-grain weight, or occurrence of a specific disease. Graph below shows schematic of the neural network model we used for predictive analysis.
Independent (controlled or uncontrolled) farming data are the input to neural net model and yield is the predicted output
We used scaling method (Sklearn MinMax Scaler) to normalize variance of numerical inputs. One-Hot-Encoding was used to deal with categorical values in the input. Samples were divided to train (70%), test (20%) and cross validation (10%). The final structure had 64 features fed to a network with 50 Tanh units followed by a 0.5 dropout layer (as regularizer) for 65 epochs. Keras API was used as the platform to run the neural net on. Mean absolute error (MAE) was used as the loss function to be minimized.
Cost function error vs. Epochs; Train set shows higher error because of the dropout layer in model
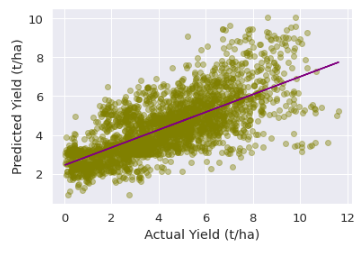
Prediction of yield in wheat farms vs. true yield using neural net model
We did not perform hyper-parameter tuning (trying different structures and models) in this work as the intention is to prove usability and predictive power of data science in agriculture rather than hitting the highest possible accuracy. The R2 for the test samples (i.e., farming experiments never seen by model during training) is 55%, and mean absolute error is 1.3 t/ha.
This means knowing some inputs (such as amount and type of fertilizers in 1st, 2nd and 3rd round, longitude and latitude, historical weather info, space between rows, pesticide, and irrigations) the model could predict the expected yield with almost 1.3 t/ha of error. This is a good result considering that these experiments were done all over the world (i.e. extreme environmental variability) and the yield could vary from 0 up to 12 t/ha. The model was trained just as a proof of concept with minimal hyper-parameter tuning.
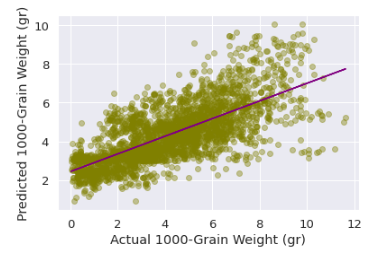
We used the same model to predict the value of 1000-grain weight. The neural net could predict 1000-grain weight with R2 score of 48% and mean absolute error of 6 g. The relatively small error compared to the yield prediction is partially because of smaller relative variance of 1000-grain weight values compared to that of yield.
Prediction of 1000-grain weight of wheat vs. true value
2. Predicting Diseases in Wheat
We ran the same model to predict the occurrence of foliar disease. The structure of model was the same apart from last layer, where softmax classifier unites were used. The softmax units produce probabilities and the class with highest probability is picked as the predicted label.
The structure of neural net ML used to predict foliar disease extent in wheat farms
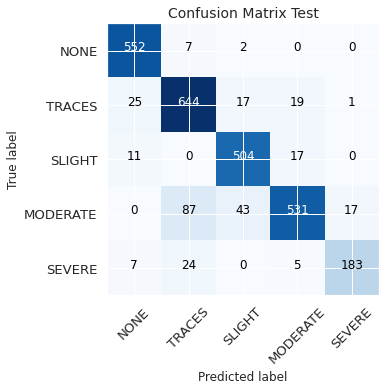
The performance of the classifier is shown as a confusion matrix where the diagonal represents the cases that the model got it right. A reliable classification model should result in values much larger in diagonal of confusion matrix compared to other cells.
Confusion matrix of true labels vs. predicted labels of foliar disease extent in wheat farms
3. Feature Importance for Data Science in Agriculture
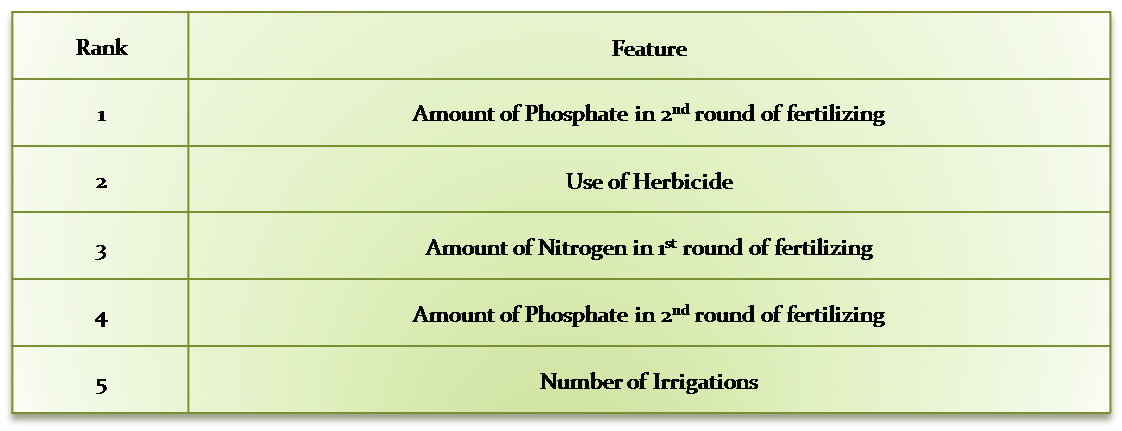
In order to better explain our ML models, we used SHapley approach. SHapley implements coalitional game theory to separate importance and affect of features on the output. The method has to be used on each trained model individually. Here are the top 5 most important features affecting the wheat yield;
Top 5 important attributes that affected the yield of wheat farms
Data Science in Agriculture and Data Leakage
Leaking data means the inputs could hint the model about output in a cheating way. We make particular attention to avoid leaking output to the model. Specifically in agricultural predictions this should be taken care of with some domain knowledge as interactions between inputs and outputs could be multifaceted. For example, if one feeds features such as ‘plant height’ or ‘weed problem’ to a model to predict yield, a time lag should be applied between inputs and outputs. Otherwise, the model and its accuracy is no longer useful because those features can be measured around the same time that yield is measured, and in such a case a model did not predict anything useful even if it hits a high accuracy.
Bottom Line
Machine learning models together with descriptive analysis make a powerful tool as data science in agriculture for farmers to reduce cost, predict yield and diseases and act upon unlocked information obtained from data science techniques.
Do you need more specific details on application of data science in agriculture for your specific upcoming project?