The cost and time-demanding nature of biodiversity assessments make a comprehensive picture of biodiversity change in US croplands unavailable. Using multiple databases, satellite images, and AI, our time-series analysis shows that the variety of crops grown in US farmlands has reduced over time in favour of soy/corn farms.
a map and a pie chart showing Land cover breakdown in 2021 - Wells County, North Dakota, US

What is Biodiversity Assessment?

Biodiversity assessment is a complex process that involves identifying and counting the number of different plant species (known as Floristic surveys), animal species (Faunistic surveys), assessing quality and quantity of different habitats within a particular area (Habitat assessment) and even soil analysis. The main drawback with these established biodiversity assessments is the cost/time demanding nature of it, particularly if it’s to be done on scale, which makes a comprehensive picture of biodiversity change in US croplands unavailable.

Our Approach to Biodiversity Monitoring

We use multiple databases, satellite images and AI to monitor macro-change in land cover and land use as a proxy to micro-change in croplands biodiversity. While it may not be possible to observe butterflies and earthworms through satellite imagery, we can see how land is changing in national or local scale over time , and we can quantify it reliably. Let’s start with a macro view of land cover change in US over past 15 years.

A bar-chart showing croplands in the US that have expanded by 110,000 square kilometers from 2008 to 2022. The conversion of natural grassland/pastures to croplands has resulted in a net loss of natural habitat.
Changes in US land cover/land use from 2008-2022

The graph is self-illustrating. Croplands [1] expanded by 110,000 square kilometers. Urban population do not give away their land, water bodies are not usable for croplands, so natural land [2] is the loser here. There is a dynamic going on between different natural land covers: climate and human activities could gradually transform one form of natural land to another over the years. All in all, the net loss in natural habitat in US comes from loss of grassland/pastures to croplands.

The graph is a bar chart that shows cropland area change in US from 2008 to 2022 with soy and corn having the highest increase.
Changes in the area of crops in US from 2008 to 2023

Quite interestingly, acreage of all crops combined – except for soy and corn – also decreased. This means the high-level trend of biodiversity over past 15 years in the US has been a gradual diminishing of grasslands toward further expansion of corn/soy farmlands. 

A map from the US showing that not all states suffered the same loss of natural land cover. Most of the biodiversity loss occurred in mid-west.
Biodiversity loss in the US at the state and county level

Not all states suffered the same loss of natural land cover. Our state by state analysis revealed that most of the loss occurred in mid-west. Even in every single state, the loss of biodiversity could vary substantially from one county to another. Thanks to cloud computing power and abundance of satellite data, we even can locate conservation or loss of biodiversity at sub-county scale;

A map showing how biodiversity is different at sub-county level in Minnesota, US.
Biodiversity loss in Minnesota, US

While loss of natural land to cropland is a shocking but quite familiar story, it is not the whole story from biodiversity point of view. Croplands are part of the ecosystem and could contribute to biodiversity to some extent; after all, pastures are mostly replaced by farms not by buildings. If croplands in an area grow variety of crop types, the diversity of plants, even if they are not perennials, is a positive effect for ecosystem of croplands in that area.

Biodiversity of a single farm does not mean much, unless it's evaluated against the ecosystem that the farm belongs to

Our time series analysis of croplands in US revealed that over time the variety of crops grown in US farmlands reduced to provide more space for more soy and corn farms. 

Consolidation of farmlands, USDA subsidies for corn producers, and great economy of soy farms have been driving factor for corn/soy farms covering the face of US croplands, and ecosystem silently but not without consequences paid the price for that.

As you see in the graphs below, diversity of crop type and land use in winter wheat, forest and a good part of wetlands are vanished in Red Lake County in Minnesota from 2008 to 2021 in favour of more corn and soy farms.

A map and a pie chart showing Land use breakdown in Red Lake County in Minnesota, US in 2008
Land use breakdown in Red Lake County in Minnesota, US in 2008
A map and a pie chart showing Land use breakdown in Red Lake County in Minnesota, US in 2021
Land use breakdown in Red Lake County in Minnesota, US in 2021

Persuading Farmers to Improve Biodiversity

While it seems that natural lands and their biodiversity don’t have much against financial drivers in farming industry, game rules are changing. We are not talking about regulations, although it’s bound to change as well, but in the free market the flow of capital finds new directions recently. 

Let start with the fact that a farm is a business that aims to maximize its return over short and long period of time. Farmers logically plant corn and soy if that’s what provided the best ROI for their business. Change occurs when the premium for planting variety of other crops or having trees or shrubs around/in the farm are good enough so that it’s economically a good choice for the farm business to adopt them. That change is coming to market in different forms including voluntary carbon credits, regulations and biodiversity credits. Let’s discuss the latter.

What are biodiversity credits/offsets?

“Biodiversity credits” or “biodiversity offsetting” are often used interchangeably with “conservation/environmental offsets” and refer to the process of compensating for the impacts of a development project on biodiversity by preserving or restoring natural habitats elsewhere. Similar to voluntary carbon market, it could become quickly controversial as might entail restoring biodiversity at one place with cost of destroying nature at another one. We soon will see how it unfolds, however, our prediction is that the focus on biodiversity expands well beyond credits/offsets. 

Thanks to increasing consumer awareness around the impact of their consumption, food companies finally started initiatives around mitigating environmental impacts of their source ingredients. 

All major food companies in NA know where their grains are coming from, even if they don’t know to the farm level because of mixing in elevators, they know their source area/county year after year. For many decades, grains are priced based on grades (or so called ‘quality’ of grain), and  virtually no purchaser cared about the history of land it grew on, at least in term of dollar value. Future will be different.

Unlike the traceability of food in value chain to specific farms, tracing back a cargo of grains to its area/county of origin is totally doable without a need to disrupt supply chain of grains

As an example, let’s consider two producers of soy and corn: York county in Nebraska and Wells county in North Dakota. In York county, 64% of the land was covered by maize farms and 26% by soy in 2021. This means that an animal or insect that cannot survive in an area covered almost entirely by maize farms does not belong to York county. On the other hand, Wells county has a rich diversity of land cover and land use, with a variety of different crops grown in the same year.

A map and a pie chart that show Land cover breakdown in 2021 - York County, Nebraska, US
Land cover breakdown in 2021 - York County, Nebraska, US
a map and a pie chart showing Land cover breakdown in 2021 - Wells County, North Dakota, US
Land cover breakdown in 2021 - Wells County, North Dakota, US

Market is gradually shifting toward pricing in such difference to add more value to conserving the biodiversity. Market pricing is gradually shifting to add more value to practices that prioritize conservation of biodiversity.

Some technical notes:

[1] we used following crops to assess croplands in US: Corn, Cotton, Rice, Sorghum, Soy, Sunflower, Winter Wheat, Alfalfa,Barely, Durum Wheat,  Spring Wheat, Millet, Oats, Canola, Hay, Sugarcane, Chickpeas, Lentils,  Fallow/Idle Cropland, Triticale

[2] We put these sub-categories as natural lands: Evergreen Forest,Woody Wetlands, Deciduous Forest, Grassland/Pasture, Shrub land, Barren, Mixed Forest, Herbaceous Wetlands

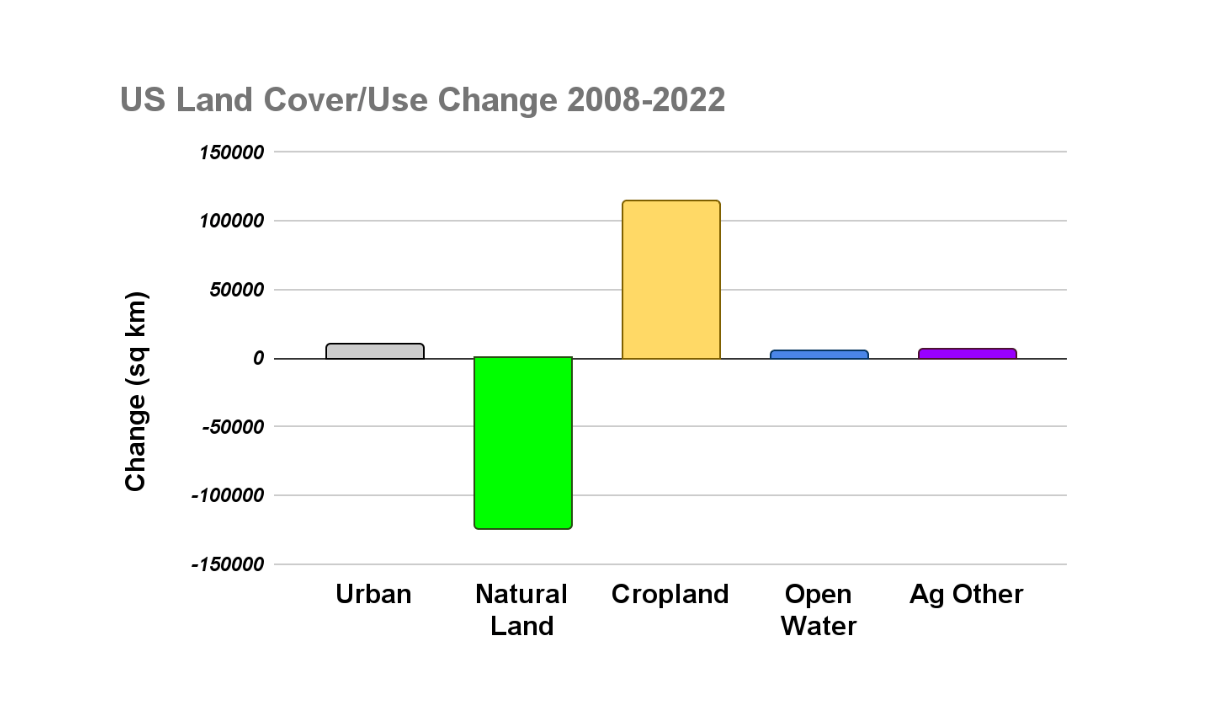
At GDS, we build software tools and dashboards that measure current and historical land cover and land use changes and their patterns over time.
Our goal is to help create a better planet for future generations. If you are interested in scalable biodiversity assessments, please reach out to us at
info@graindatasolutions.com

Please share on social media!

Sign up for our Newsletter