AI for Yield Prediction in Corn under Soil Moisture Stress
This case study shows an application of AI for yield prediction under stress and specifically drought stress. The complexity of farming data such as irrigation and precipitation patterns, makes AI a good candidate to deal with such data. Here we applied an AI technique calls DTW to predict yield of corn. The intuition behind this technique is that if we can find a farming season that is most similar to this season mathematically, then the crop yield should be similar too and we can predict it with high accuracy.
Application of AI for yield prediction is an important aspect of artificial intelligence in agriculture. AI techniques are able to analyze several attributes in crop production to predict yield specifically when there are stresses.
Among different stresses, soil moisture stress significantly affects the health of crops and the yield. The moisture stress occurs where there is too little (or too much) water content in soil at the root zone. Soil moisture condition during critical phases of the crop growth and development cycle is a great indicator of average crop yield in corn and soybeans (National Centers for Environmental Information). Soil moisture percentages and moisture stress index are keenly observed by farmers and agronomists.
Although soil moisture can be quantified as a value (percentage or index), this value has a temporal (time) attribute. This means that the value could change significantly over one farming season. This characteristic is opposed to some other farming attributes that could adequately be described once, such as yield, 1000-grain weight or distance between rows. The inherent time dimension in soil moisture means using an average value over a farming season, even next to the value of standard deviation, equals losing too much detail. To illustrate this, see the following graph for two hypothetical soil moisture profiles for a farm over two seasons. Both profiles have a mean and median around 50%, and standard deviation of around 25%. Nonetheless, a farmer intuitively knows these two profiles could result in different yields because soil moisture variations over time could affect yield distinctively in different stages of growth.
Two hypothetical soil moisture profiles with the same mean and standard deviation but different trends
In AI these attributes are called time series data. A farmer with access to precision agriculture tools collects many time series data from different locations of the farms. Farmers also collect non-time series data that they would rather to predict in advance, such as yield, harvest biomass, 1000-grains or occurrence of a specific disease. Now the question is how to interpret the relation between multiple time series inputs and single value outputs in a quantifiable way. Similarly, over different farming seasons, and along different locations in a farm, much more time series data could be collected. Examples are soil moisture at different depths, relative humidity, temperature, wind speed, and sun radiation. The challenge is that such a data (let assume data from 20 locations in a farm over 5 farming seasons) cannot even get visualized easily, let alone to make quantitative predictions based on that.
The Solution of AI for Yield Forecasting
One of the twists in dealing with agricultural data is that the length, start and end of the collected data could be different from one farming season to another. Also the intervals between data collection (e.g. frequency of collecting soil moisture data from one season to another) could vary. Because of this aspect of agricultural data, some well known unsupervised machine learning models for finding similarities between temporal patterns (such as k-means clustering of time series data) might not directly be applicable to the described problem.
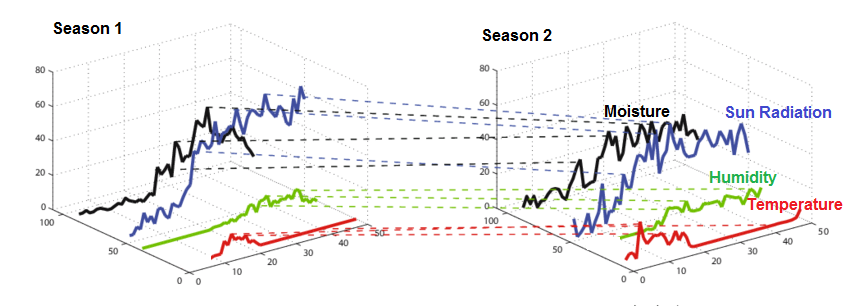
One of the approaches of AI for yield prediction is an algorithm called Dynamic time warping (DTW) which measures similarities between temporal sequences. This method very well fits to agricultural data because it can deal with multiple features data that have different time lengths and sample intervals. Image below illustrates DTW picking similarities among temporal data.
AI can find similarities of time series data with multiple attributes (original image from this source)
Case Study on How to Predict Corn Yield under Stress
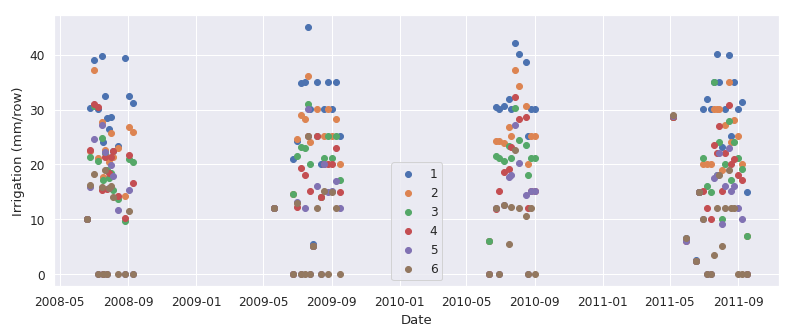
Data is from USDA Ag Data Commons, where they applied controlled moisture stress to corn plots, measured the moisture level at different depths of the soil, and measured the yield at the end of farming seasons from 2008 to 2011 in Colorado. Six different moisture stresses were applied where 1 is the mildest and 6 is the most severe stress (i.e., minimum irrigation was applied for 6).
Amount of irrigation for different stress levels (2008 to 2011)
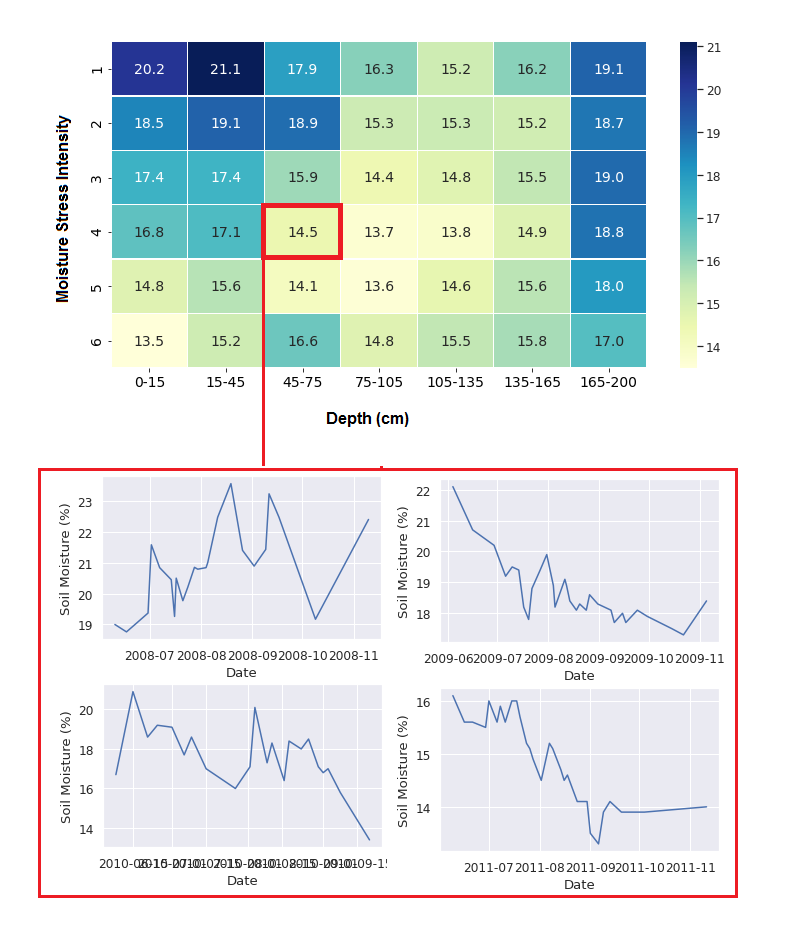
In addition to soil moisture, data from variations in temperature, humidity, sun radiation, and wind were also collected over the farming seasons. The moisture in different depths of soil depends on the sum of irrigation and precipitation, together with some other attributes such as air humidity and temperature. The heat map below shows the average soil moisture at different depths of soil for different moisture stress over farming season for 4 years.
Volumetric soil moisture (%) in different depths of soil for different extents of stress averaged over 4 farming seasons.
AI Techniques Predict Crop Yield in Drought Stress with High Accuracy
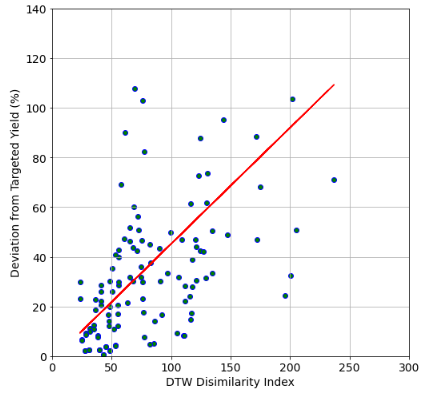
The objective here is to find the corn plots with similar temporal inputs (such as moisture and temperature), and compare the differences in the crop yield. For that reason we developed a dissimilarity index, which is the Euclidean distance obtained from DTW method. A low dissimilarity index between two plots means that maize plants – from the same hybrid – experienced similar condition, and thus should yield around the same value. The graph below shows that corn plots of similar history could have deviation in yield as small as 0 – 20%. This is very close prediction considering the yield of maize plots in this study ranged between 4-14 t/ha.
Differences in deviation from targeted yield vs. Euclidian distance
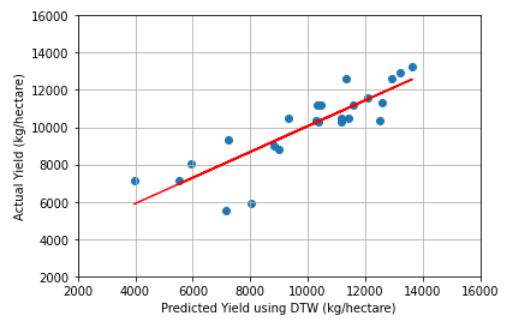
Another advantage of this method to other AI models is that DTW could be applied to rather small number of experiments, while most of machine leaning models require large datasets for the model to get trained, and evaluated on test samples. With this method, a farmer or grower could have an estimate of yield through finding and comparing the most similar historical pattern. Graph below predicts the yield of corn by finding a farming season with closest time series attributes.
The AI technique, DTW could estimate yield with R2 score of 0.73
Plants with the same genetic pool that experienced similar environmental conditions will have similar outputs.
If you collected some historical data from your farm, orchard, or greenhouse
AI has the capability to estimate, in a quantifiable approach, the yield, biomass, or breakout of a specific disease before it occurs.